Power BI offers easy-to-use bookmarks, but this powerful feature is underutilized for creating interactive, app-like experiences. Instead of static dashboards, bookmarks allow you to build dynamic reports that respond to user actions, hide and show content intelligently, and guide users through storytelling experiences.
In this tutorial, we will show how to demystify Power BI bookmarks by making reports that feel like apps.
What Does Bookmark Capture?
In Power BI, a bookmark is a saved snapshot of a report page’s current state. When you apply a bookmark, Power BI instantly restores that exact state, creating seamless transitions and interactions.
A bookmark can remember three things about a page:
- Display: Which visuals are visible/hidden, their spotlight state, and layer order.
- Data: Filter, slicer, and drill states (including cross-highlighting).
- Current page: Whether jumping to another page is part of the bookmark.
You can also set Selected visuals, so a bookmark only affects the visuals you pick, great for avoiding slicer resets.
1. Set Up the Model
Before creating bookmarks, you need to set up the model to create visuals.
Import Your Data:
- Open Power BI Desktop.
- Go to Home >> select Get Data >> select source.
- Click Load or Transform Data to import data in Power BI.

Create Relationship:
- In the Model view, Power BI automatically detects and creates relationships.
- Or you drag and drop fields to create relationships.

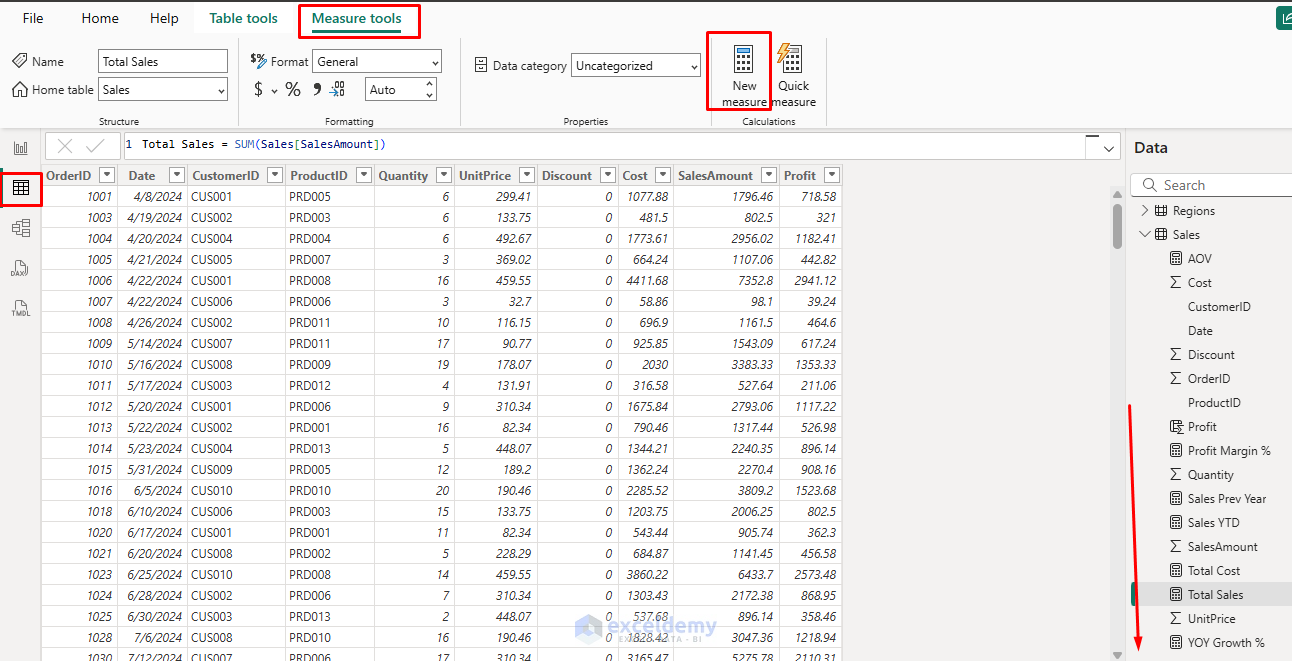
Create DAX Measures:
- Go to the Table view >> select Measure tools.
- Select New measure/column.
- Create the following DAX measures.
2. Create a Clean Base Page
You will need to create a clean base page with visuals. Based on the visuals, you can structure the layout of the Bookmark App.
Add Slicer:
- Select Slicer.
- In the Field drag the following fields;
- Date, Category, Country, State/Province.
Add KPI Cards:
- Select Card.
- Total Sales, Profit, Growth, Average Order Value.
Add Charts:
- Top Products:
- Select Clustered Bar chart.
- X-axis: Product, Y-axis: SalesAmount; Top N = 5).
- Sales Trends:
- Select Line Chart.
- X-axis: Date Hierarchy, Y-axis: SalesAmount.
- Pie Chart:
- Select Pie Chart.
- Legend: City, Values: SalesAmount.
- Name this page Overview.

3. Turn on the Right Panes
You need to constantly use Selection and Bookmarks to make reports feel like apps.
- Go to the View tab >> select Selection.
- Control visibility (eye icons) and order of visuals.
- Go to the View tab >> select Bookmarks panes.
- Bookmarks save states.

- Name your visuals in the Selection pane (e.g., KPI Sales, KPI Profit, KPI AOV, Bar Sales by Category).
- It is easy to include/exclude them in bookmarks.

4. Your First Bookmark (State Snapshot)
- Set slicers.
- Date: Whole range (2024,2025)
- Country: All
- Category: All
- State/Province: All
- Selection pane: leave everything visible.
- Go to the Bookmarks pane >> click Add >> rename to Overview – All.

- Click the ellipsis (…) on the bookmark:
- Ensure Data is on (captures filters/slicers).
- Ensure Display is on (captures visibility).
- Current page on.

- Now, change a couple of slicers.

- Then, click Overview – All; your page returns to that exact state.

5. App-Like Tabs with Bookmarks + Buttons
5.1. Category Tabs (Electronics / Clothing / Beauty / etc.)
Create Bookmarks:
- Set slicers to show Electronics only.
- Go to the Bookmarks pane >> click Add >> name View – Electronics.

- Set slicers to the Clothing.
- Go to the Bookmarks pane >> click Add >> name View – Clothing.
- Repeat for Home & Kitchen, Beauty, Books, etc. (only do your top 3–5 to keep it simple).

Tip: Lock chart sorts and drill states before saving each bookmark.
Add the Buttons:
- Go to the Insert tab >> select Buttons >> select Blank (or Tabs).

- Name the first butto.
- Click Style.
- Text: Electronics

- Select button >> open Format button.
- Action: On
- Type: Bookmark
- Bookmark: View – Electronics

- Duplicate this button, change the text to Clothing, and map to View – Clothing, and so on.
- Align them in a row at the top.
- Go to the Format tab >> select Align >> select Distribute horizontally.
- Use the Format Painter to style consistently.
Now your “tabs” switch the content like an app.

5.2. Country Focus Buttons (USA / Canada / UK) + Back
Let’s create quick country filters that feel like app navigation.
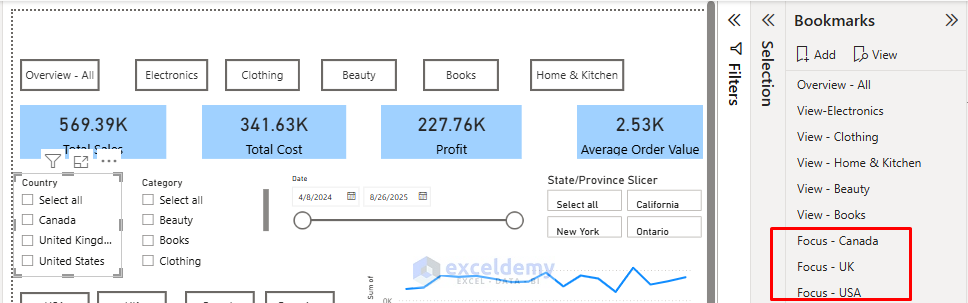
Make the Focus Bookmarks:
For each country:
- Set slicers to the United States.
- Go to the Bookmarks pane >> click Add >> name Focus – USA.
- Repeat for the UK and Canada.
Tip: If your “State/Province” slicer should clear when changing country, clear it before saving each bookmark so that behavior is baked in.
Add Small Buttons:
- Go to the Insert tab >> select Buttons >> select Blank (or Tabs).
- Create three buttons labeled Canada, UK, and USA.
- Select a button.
- Select button >> open Format button.
- Action: On
- Type: Bookmark
- Bookmark: Focus – USA
- Duplicate for Canada and the UK.
- Add a Back button:
- Click Style.
- Text: Overview
- Action: On
- Type: Bookmark
- Bookmark: Overview – All.
- Click Style.

5.3 Show/Hide Panels (True App Feel)
A Details panel slides in/out (simulated by show/hide).
Build and Group the Panel:
- Go to the Insert tab >> select Shape >> select Rectangle (right side of the canvas).

- Add a Table visual on top of it with columns like:
- Rows: ProductName
- Columns: Country
- Values: Total Sales. Total Profit
- In the Selection pane,
- Select the rectangle + table >> select ellipse (…) >> select Group >> name Details Panel.
- In Selection, also create a tiny Close button.
- Go to the Insert tab >> select Button >> select Blank.
- Drag it inside the group.

Two Bookmarks: On/Off
We want these to only control visibility (not slicers), so:
- Hide the group Details Panel (eye off).
- Go to the Bookmarks pane>> click Add >> rename Details – Off.
- Open the (…) for this bookmark.
- Ensure Data: Off, Display: On, Current page: On.
- Show the group Details Panel (eye on).
- Go to the Bookmarks pane>> click Add >> rename Details – On.
- Ensure Data: Off, Display: On.

Buttons to Toggle:
- Add a Show details button on your page.
- Select button >> open Format button.
- Action: On
- Type: Bookmark
- Bookmark: Details – On
- Name it from Style.
- Select button >> open Format button.
- Select the Close button inside the panel:
- Action: On
- Type: Bookmark
- Bookmark: Details – Off
- Add a Details Off button on your page similar to the Close button.

Now the drawer opens/closes without resetting filters.
Format and Test the App
- Insert a heading.
- Apply a fill color to the buttons, increase the font size, and apply formatting.
- Organize the Buttons/Tabs, Slicer, and Visuals.

- Select the USA tab.
- The entire report is updated automatically.
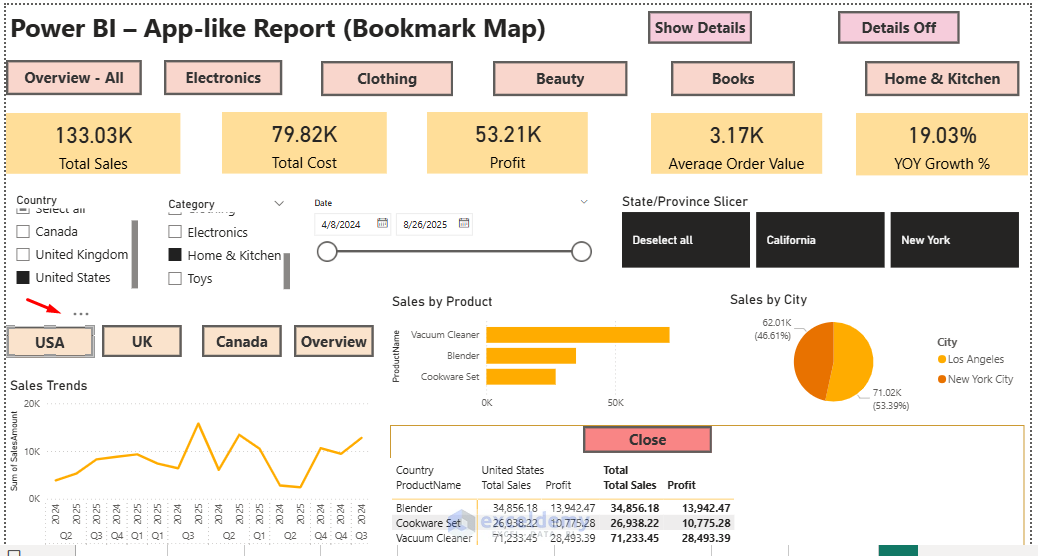
- Click on the Details Off button.
- The details panel is currently hidden.

Best Practices
- Group Bookmarks: Organize related bookmarks into folders for easy management.
- Update Carefully: Always right-click and Update after making changes, otherwise bookmarks may reset unexpectedly.
- Use Buttons, Not Just Pane: Users won’t open the Bookmark Pane; instead, give them intuitive buttons or icons.
- Keep It Simple: Too many bookmarks can confuse users; design clear flows.
Conclusion
By following these techniques, you can make Power BI reports feel like Apps that stand out as professional, interactive experiences that users want to engage with regularly. Power BI bookmarks can transform static reports into interactive applications. By combining them with buttons, selection controls, and smart navigation, you can design dashboards that don’t just display data; they guide, engage, and empower users. Start simple with basic show/hide functionality, then gradually incorporate advanced patterns like progressive disclosure and story navigation. The best bookmark implementations feel invisible to users. Bookmarks should enhance the natural flow of analysis rather than add complexity.
Get FREE Advanced Excel Exercises with Solutions!

It seems that no Power BI-related posts are grouped in the Tutorials ribbon. Where can I find it?
Hello Julian,
Thank you for pointing that out! Currently, our Power BI-related posts are not grouped under the “Tutorials” ribbon, but you can still find them by using the search bar or browsing the Power BI Category on the site.
We’ll also look into improving the navigation so Power BI tutorials are easier to access in the future.
Regards
ExcelDemy