
Power BI and Excel are powerful tools on their own, but DAX (Data Analysis Expressions) measures provide analytical capabilities that can significantly enhance Excel reports. By leveraging these measures, you can deliver interactive, dynamic, and insightful reports that go far beyond traditional spreadsheet analysis.
In this tutorial, we show how to use Power BI DAX measures to enhance Excel reports.
What Are DAX Measures?
DAX measures are calculations that evaluate expressions in the context of the current filter context. Unlike calculated columns, measures are evaluated dynamically based on the report context.
Creating DAX Measures in Power BI
Step 1: Load Data to Power BI
- Launch Power BI Desktop
- Import your sales data into Power BI Desktop
- Go to the Home tab >> from Get Data >> select your preferred source
- Browse and select your file >> click Open

- In the Navigator dialog box, select your data
- Click Load or Transform Data

Step 2: Create Basic DAX Measures
Let’s create DAX measures.
- Go to the Table View from the left navigation pane
- Go to the Table Tools tab >> click New measure
- Enter the DAX formula

Total Sales:
Total Sales = SUM(Sales[SalesAmount])

Total Profit:
Total Profit = SUM(Sales[Profit])
Profit Margin:
Profit Margin = DIVIDE([Total Profit], [Total Sales], 0)

Sales Growth:
Sales Growth =
VAR CurrentPeriodSales = [Total Sales]
VAR PreviousPeriodSales =
    CALCULATE(
        [Total Sales],
        DATEADD(Sales[Date], -1, YEAR)
    )
RETURN
DIVIDE(CurrentPeriodSales - PreviousPeriodSales, PreviousPeriodSales, 0)
Top Customers:
Top 5 Customers Sales =
CALCULATE(
    [Total Sales],
    TOPN(5, VALUES(Sales[CustomerName]), [Total Sales])
)

Step 3: Publish to Power BI Service
- Go to the Home tab >> click Publish
- Select your workspace (for example, My workspace)
- Click Select

- Confirm that the dataset is published successfully
- Open the published file in Power BI Service

Connecting Excel to Power BI
Method 1: Using Analyze in Excel
- In Power BI Service, open My workspace
- Navigate to your dataset
- Click More options (…) >> select Analyze in Excel

- Download and open the Excel file

- Excel automatically connects to your Power BI dataset
Method 2: Using Get Data
- Open Excel
- Go to the Data tab >> Get Data >> select From Power Platform >> select From Power BI

- Sign in to your Power BI account
- Select your workspace and dataset
- Insert PivotTable
- Insert Table

- Choose the measures in the PivotTable you want to import

- Choose the measures and insert the table

Method 3: Direct Connection
- In Excel, go to the Data tab >> Get Data >> select From Other Sources >> select From Analysis Services
- Enter the Power BI Service URL
- Select your dataset and authenticate
Using DAX Measures in Excel
Creating PivotTables with DAX Measures
Once you complete the above steps, you will get the downloaded Excel file.
Add Measures to PivotTable:
- Open the downloaded Excel file >> click Enable Editing

- It automatically imports a PivotTable from Power BI Service
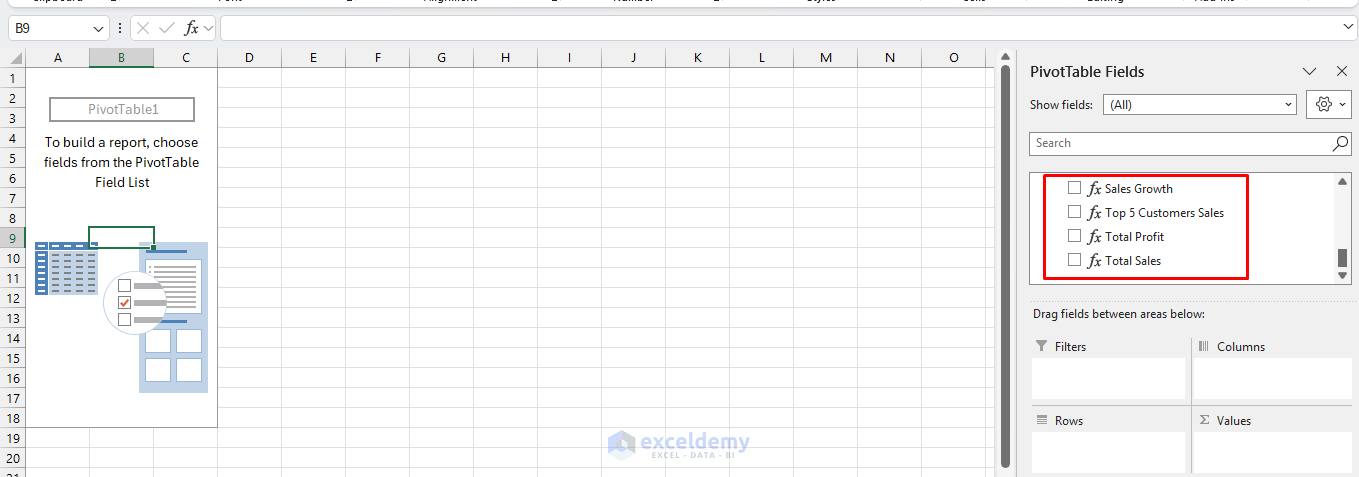
- From the PivotTable Fields pane, drag your DAX measures to the Values area
- Rows: Category, Product Name
- Values: Total Sales, Profit Margin %
- The measures are calculated automatically based on the context

Creating Charts with DAX Measures
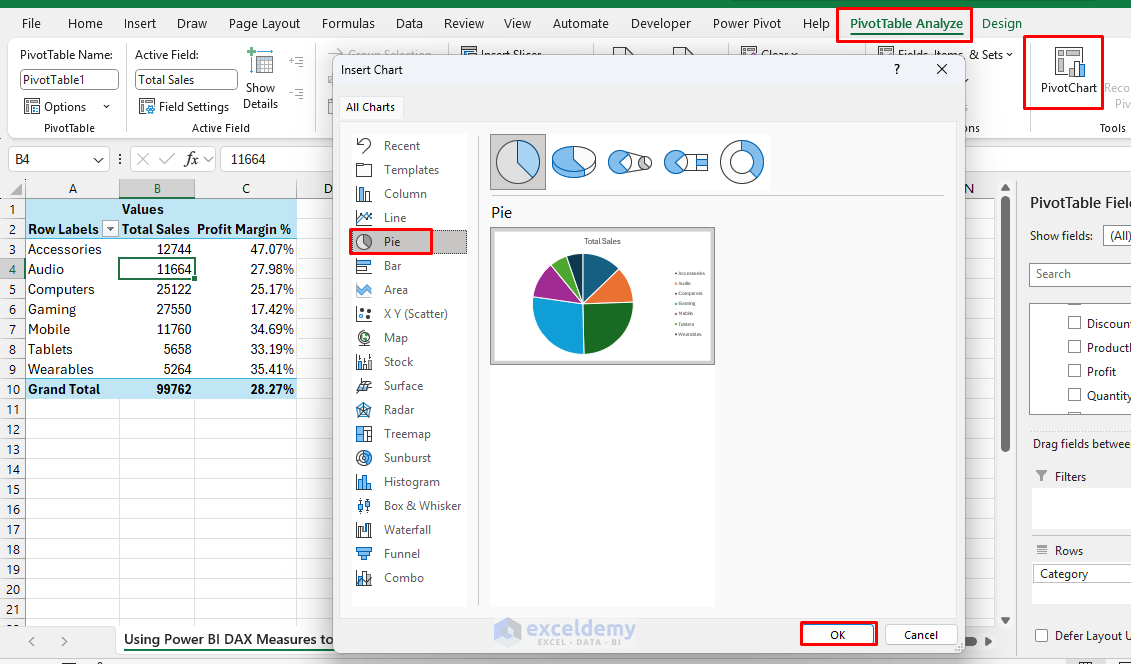
Create Chart:
- Click any cell in your PivotTable
- Go to the PivotTable Analyze tab >> select PivotCharts
- Choose your preferred chart type
- Click OK
Customize Your Chart:
- Add titles and labels
- Format axes and data series
- Include multiple measures for comparison

Using Slicers and Filters
Inserting Slicers:
- Select your PivotTable
- Go to the PivotTable Analyze tab >> select Insert Slicer
- Choose the fields you want to filter by
- Select Region
- Click OK

- Position slicers on your worksheet

Filter Effects: When you use slicers or filters, your DAX measures automatically recalculate based on the new context, providing dynamic insights.
- Select the East region from the slicer

Conclusion
Integrating Power BI DAX measures with Excel reports creates a powerful analytical solution. It combines the advanced calculation capabilities of Power BI with Excel’s familiar interface and formatting options. By following these steps and techniques, you can enhance your Excel reports with advanced analytics while retaining the ease of use that Excel provides. Start with simple DAX measures and gradually experiment with different DAX functions and Excel features to discover new ways to enhance your reporting capabilities.
Get FREE Advanced Excel Exercises with Solutions!
