To solve these problems, you need to be familiar with inserting pivot tables, using slicers, utilizing calculated fields, inserting pivot pie charts, building a data model, and grouping by year. If you have Excel 2010 or later, you can solve these exercises without any compatibility issues.
Download the Practice Workbook
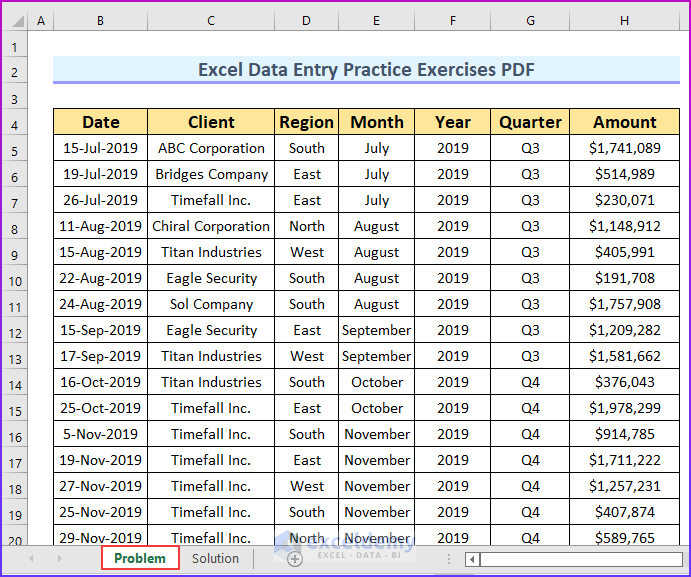
Problem Overview
There are seven columns and 714 rows in our dataset, which represents sales data for a company from 2019 to 2022. The “Amount” column refers to the sales amount for the particular date.
Here’s a list of exercises:
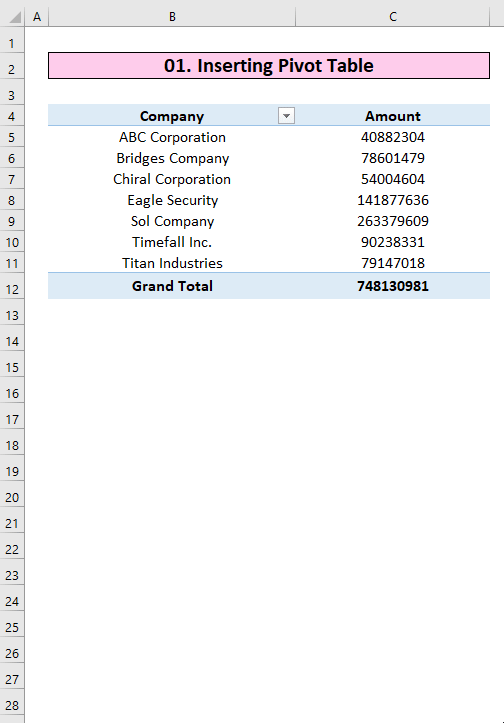
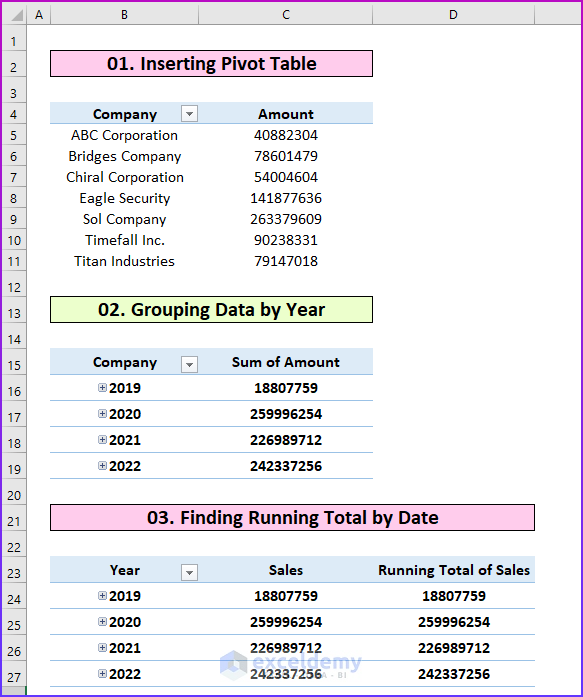
- Exercise 01 – Inserting a Pivot Table: Make a pivot table, then remove the grand total and edit the pivot table. Then, hide the Gridlines from the table.
- The following animated image shows how to hide the grand total value.
- Exercise 02 – Grouping Data by Year: Group the sales amount by the year. Additionally, you can try to group the data by weeks and months.
- Exercise 03 – Finding a Running Total by Date: Find the running total by date using the data.
- Exercise 04 – Inserting a Pie Chart: Create a pie chart from the data in this problem.
- Exercise 05 – Adding Slicers to the Pivot Table: Insert a slicer to the pivot table.
- Exercise 06 – Using a Calculated Field: You will need to find the sales tax which is 5% of the total sales using the calculated field. Remember, to import the pivot table as a data model.
The following image shows the first three solutions.


Thank you!! Rafiul Haq.
Dear Minhajul,
You are most welcome.
Regards
ExcelDemy
Answer to exercise 3 is wrong. Sales and Running total of Sales have the same values. Otherwise nice exercise
Dear Qasim,
Thanks for your suggestions we have updated our Exercise 3 you can check it now.
Regards
ExcelDemy
Great work exceldemy team! Really healped me a lot.
Dear Foysal,
You are most welcome.
Regards
ExcelDemy
Do you have any YouTube channel?
Dear Ashab,
We do have a YouTube channel named ExcelDemy
Regards
ExcelDemy
Solve this in a video and upload on your youtube channel. Its a very helpful.
Hello Rao,
We will try to upload it in our up coming videos.
Regards
ExcelDemy
What is the purpose of computing or finding the running total?
Hello Emz,
The purpose of computing or finding the running total in a pivot table is to observe cumulative values over time or sequential categories. It will help you to identify trends, monitor progress, and understand how data accumulates.
For example, in sales data, a running total allows you to see how much revenue has been generated up to a certain point. It provides insights into overall performance, allowing for easier analysis of growth or decline. This is especially useful in tracking inventory, financial data, or project timelines.
Regards
ExcelDemy