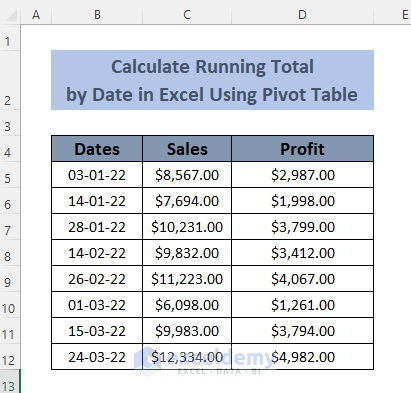
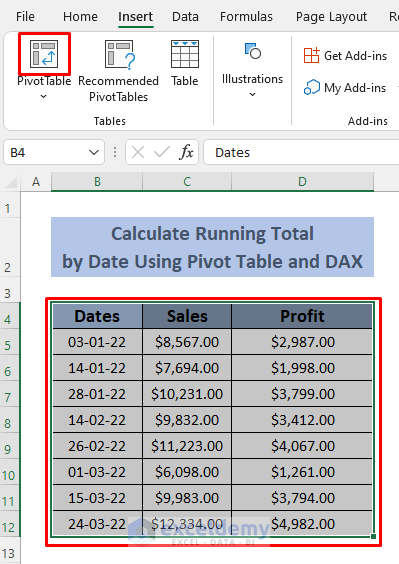
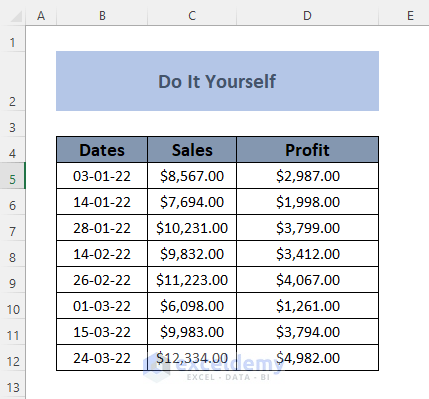
The dataset below showcases sales and profit of a company in different dates.
Method 1 – Using the Value Field Settings to Create the Running Total by Date
To see the running totals of sales on individual dates:
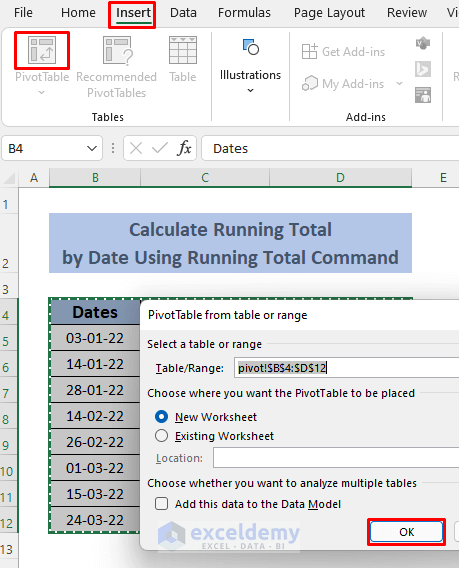
- Select B4:D12 and go to Insert >> Pivot Table.
- In the dialog box, click Ok.
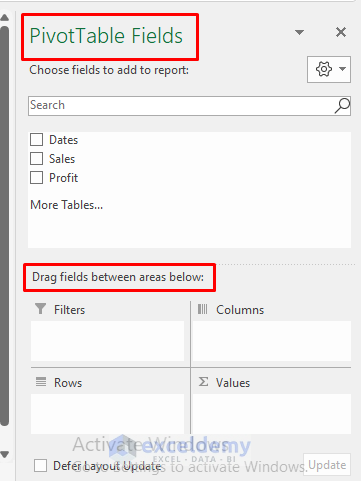
- A new sheet will open with the Pivot Table fields and Areas.
- Drag the Dates field into the Rows.
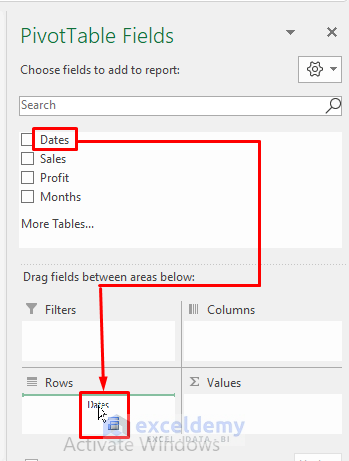
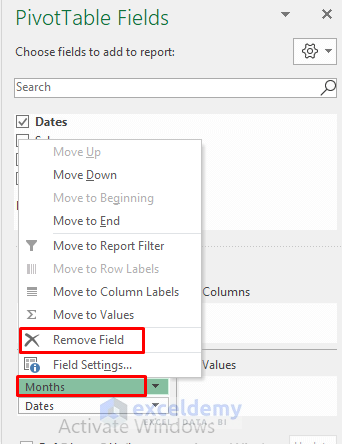
- You will see the Months section in the Rows.
- To see running totals by date, remove the Months.
- Drag the Sales field two times to Values. You will see two sections- Sum of Sales and Sum of Sales2.
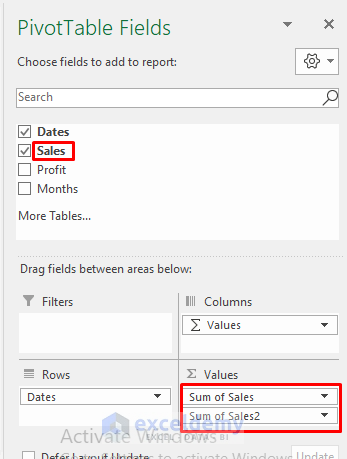
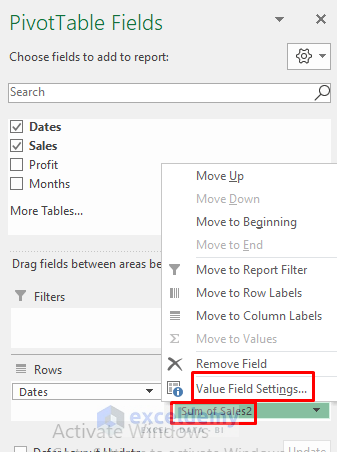
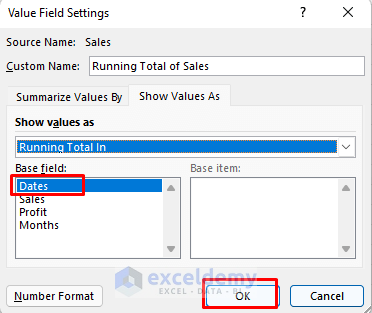
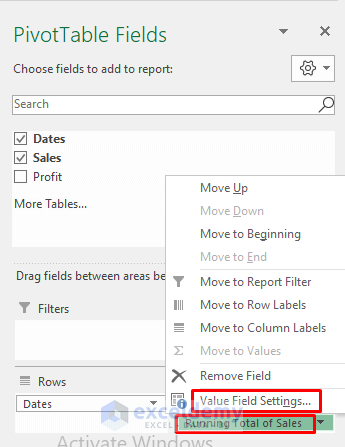
- Select Sum of Sales2 and go to Value Field Settings.
- Name your running total column in the Custom Name section. Here, Running Total of Sales.
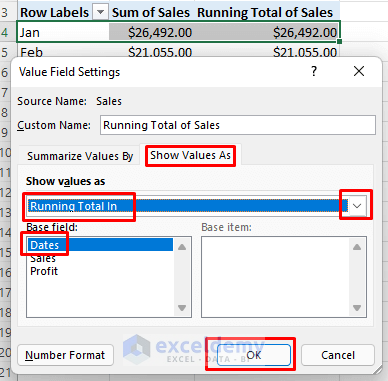
- Choose Show Values As.
- Click the arrow in Show Values As and select Running Total In.
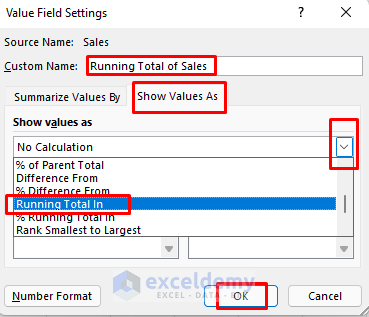
- Choose the Base Field as Date and click OK.
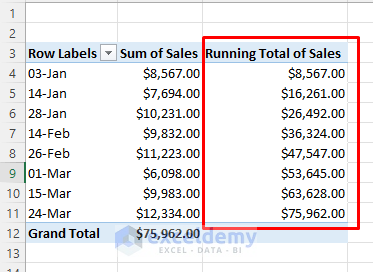
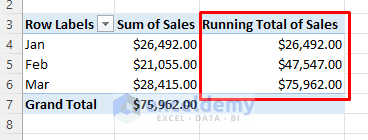
You will see the individual sales and the cumulative sales in the Pivot Table.
Method 2 – Grouping Dates by Month in a Pivot Table to Create a Running Total
To see the running totals of sales:
Steps:
- Create a Pivot Table for the running totals of Sales and Dates: see Method 1.
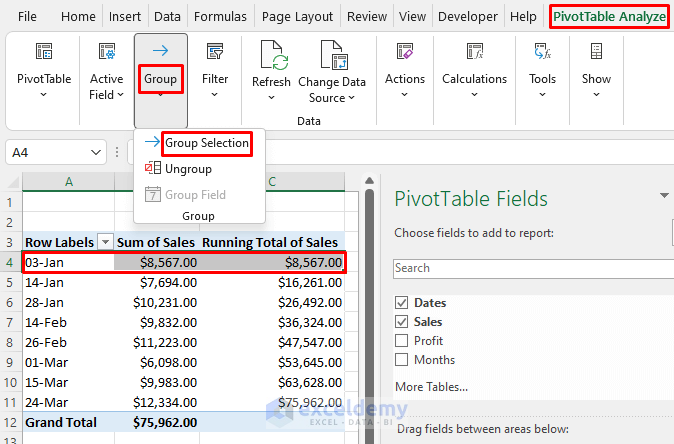
- Select A4:C4 in the Pivot Table and go to PivotTable Analyze >> Group >> Group Selection
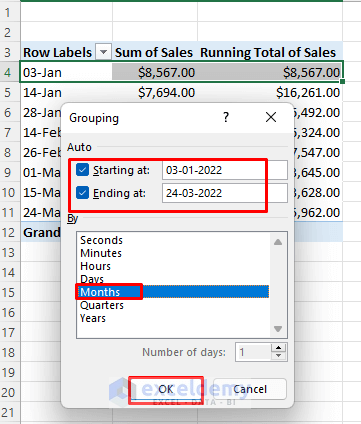
- Set the date in the Grouping dialog box in the ‘Auto’ section and choose Month in ‘By’
- Click OK.
- Go to Running Total of Sales in ‘Values’ area and select Value Field Settings…
- Choose Show Values As, select Running Total In in Show Values As and set the Base field to Dates.
- Click OK.
You will see the running totals of sales in individual dates grouped by months.
Method 3 – Using an Excel Pivot Table and DAX to Calculate a Running Total by Date
To see the running totals of profits:
Steps:
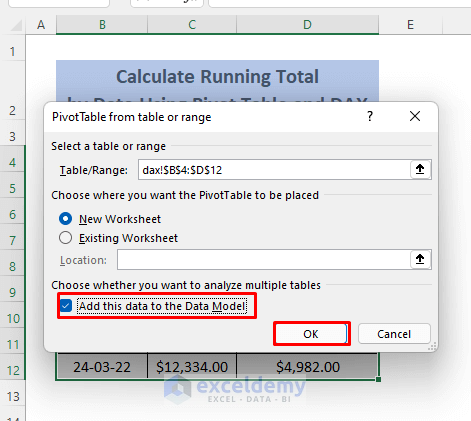
- Select B4:D12 and go to Insert >> Pivot Table
- In the dialog box, select Add this data to Data Model and click OK.
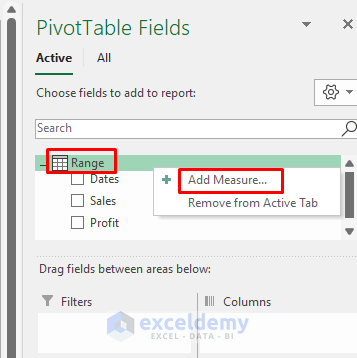
- You will see Pivot Table fields and areas.
- The Table name is Range.
- Right-click it.
- Select Add Measure.
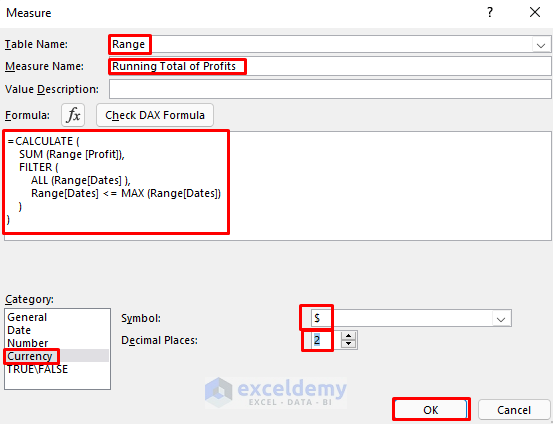
- In the new window, enter a name in Measure Name (Here, Running Total of Profits)
- Enter the following Formula.
=CALCULATE(
SUM(Range [Profit]),
FILTER(ALL (Range[Dates] ),
Range[Dates] <= MAX (Range[Dates])
)
)
- Set the Number Format to Currency and choose decimal points.
- Click OK.
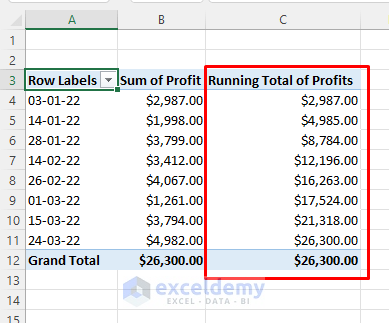
The running total of profits is calculated by comparing the dates and profits. The FILTER function was used to filter the dates.
- Drag the Date Field to Rows.
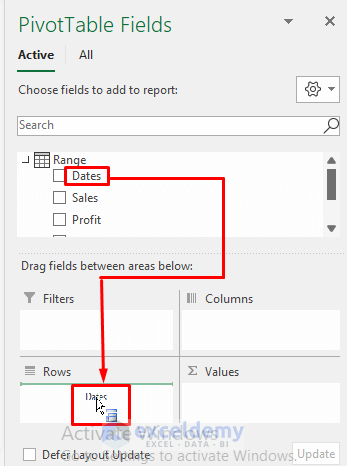
- Check Profit and fx Running Total of Profits in Pivot Table Fields.
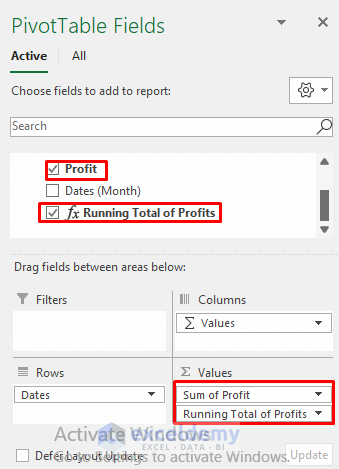
You will see the running total of the profits and the dates.
Practice Section
Practice here.
Download Practice Workbook
<< Go Back to Pivot Table Calculations | Pivot Table in Excel | Learn Excel
Get FREE Advanced Excel Exercises with Solutions!
