How to Calculate WACC in Excel (with Easy Steps)

WACC is a useful parameter that can help you to extract insight about a company. You can use this parameter to decide whether you should invest or not in this company. If you are curious to know how you can calculate the WACC in Excel, then this article may come in handy for you. In this article, we discuss how you can calculate WACC in Excel with an elaborate explanation.


Overview of WACC

Definition

The weighted average cost of capital (WACC) indicates a firm’s average cost of capital from all components, and different types of stocks like preferred stock, common stock, bonds, and other types of debt.

  • The WACC is also regarded as the rate at which the organization has to pay its stakeholders. Another name is the Simple Cost of Capital.
  • Most businesses have to fund their operations, and this capital is usually through debt, equity, or an amalgamation of the two. There is a cost tag attached to every information source.
  • Calculating the WACC is a useful tool for comparing various financing choices because it gives the company an idea of how much the venture or business will cost to fund. If the value is less than the financial return, the project will add value or assets to the company. Otherwise, if the calculated WACC is more than the return on investment, then the project will lose money or assets in the long run.
  • The WACC also helps to understand which proportion of equity and Debt will bring the best WACC rate. They need to tweak the proportions of the debt and equity with respect to the total capital until they find the best possible WACC.

Formula of WACC

Here,

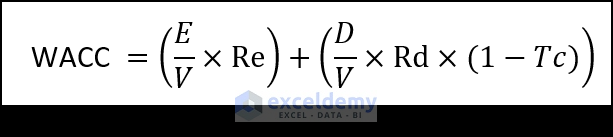
E = Equity Value of the Company

V = Total Value of Debt and Equity of a Company.

D = Total Debt of a Company.

Tc = Tax Rate.

Re = Cost of Equity.

Rd = Cost of Debt.

We can also present it like the below image.

Here weightage is basically the ratio of Equity and Debt with respect to the summation of Equity and Debt.


Components of WACC

WACC has four essential parameters or components. Without any of them, calculations of the WACC are impossible.

1. Market Valuation of Equity

The market value of the Equity is mostly regarded as the summation of the price of outstanding shares of a particular company.

2. Cost of Debt

This is the price that the company must pay for the debt (bonds or loans) it took.

  • The Cost of Debt is a very good indicator of a company’s risk factor. Riskier companies have a higher amount of Cost of Debt compared to the other companies.
  • They are calculated by the following formula:

Cost of Debt = Interest rate x (1 – Tax rate)

3. Market Valuation of Debt

Estimation of the total Debt is troublesome as the debt in most cases isn’t public. They usually don’t even list in the outstanding share. It can be calculated from the listed bond price or from the bank statements.

4. Cost of Equity

In one word, it is defined as the rate of return of stocks or shares issued by the company as expected by the shareholder.

  • When a share is issued, the company doesn’t pay any money for the stock. Instead, it sells a small chunk of the company share, and the share is bought by the shareholders.
  • As the performance of the company gets ups and downs, so do the stock prices. But shareholders expect a certain amount of return front the share they bought. The return has to be generated by the company.
  • This is the price the company must pay in the long run in order to generate investment. This cost is described as the Cost of Equity. It is presented as the formula below:

Cost of Equity = Risk Free Rate + Beta * (Market Return Rate – Risk Free Rate)


Step-by-Step Procedure to Calculate WACC in Excel
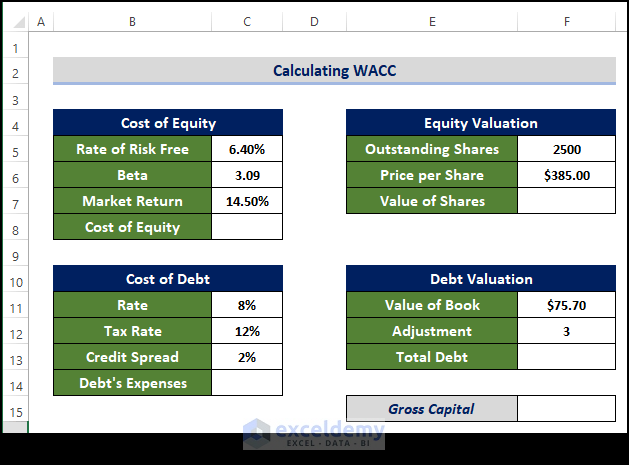
Below, an example of how you can calculate the WACC of a company is presented with a step-by-step procedure.


Step 1: Prepare Dataset

Before we delve into calculating WACC, we need to prepare the input data which will help us to calculate the WACC.

  • In order to calculate the WACC, we need to calculate some parameters or the component first.
  • The components are Cost of Equity, Equity Evaluation, Cost of Debt, Debt Valuation, etc.
  • Furthermore, we need some more information to calculate those parameters.
  • Those pieces of information are organized as shown below.
  • Each parameter required unique information.
  • Like Cost of Equity required information like the Rate of Risk-Free, Beta, and Market return.
  • The cost of Debt required information like Rate, Tax Rate, and Credit Spread.
  • Equity and Debt requirements vary wildly from company to company.
  • Equity actually represents the total amount of money that the company has to return if it decides to liquidate all the assets. So the calculation may involve shares of different types, retained earnings, etc. In this case, we presented only the share quantity and the price per share. With this, we could calculate the total price of the share hence the total Equity.

Prepare Input Data to Calculate Wacc in Excel

Read More: How to Convert Percentage to Basis Points in Excel


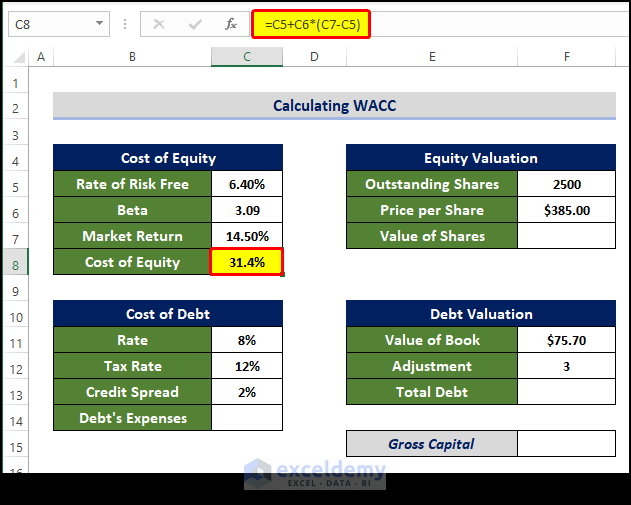
Step 2: Estimate Cost of Equity

Now that we have the necessary information, we can now determine the Cost of Equity.

  • Now we are going to calculate the Cost of Equity using the parameters presented here.
  • To do this, select the cell C8 and enter the following formula:

=C5+C6*(C7-C5)

  • Entering this formula will instantly calculate the Cost of Equity in cell C8.

Estimate Cost of Equity to Calculate Wacc in Excel


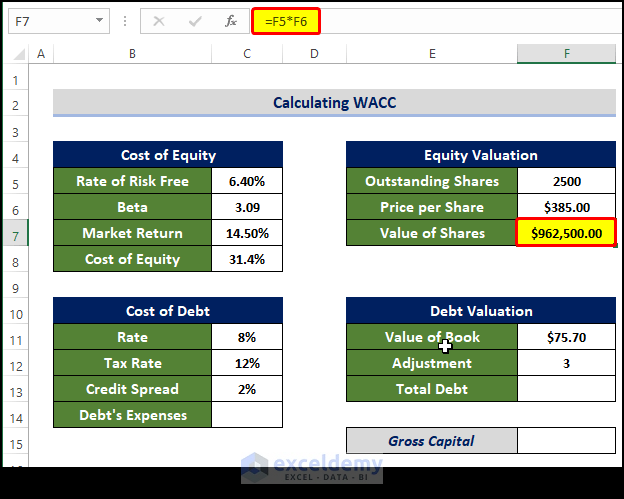
Step 3: Calculate Market Valuation of Equity

Now that we have the necessary information, we can now determine the Market Valuation of Equity.

  • Now we are going to Evaluate the Equity using the parameters presented here.
  • To do this, select the cell F7 and enter the following formula:

=F5*F6

  • Entering this formula will instantly calculate the Total Equity in the form of Total Share Value in cell F7.

Calculate Market Valuation of Equity to Calculate Wacc in Excel

Read More: How to Calculate Profitability Index in Excel 


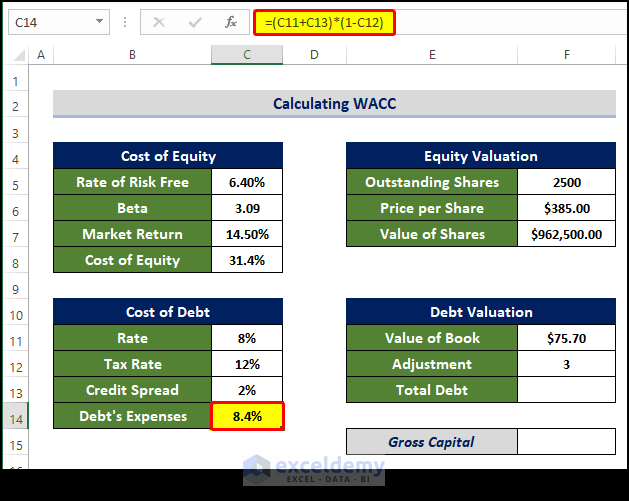
Step 4: Estimate Cost of Debt

Now that we have the necessary information, we can determine the Cost of Debt.

  • Now we are going to Evaluate the Cost of Debt using the parameters presented here.
  • To do this, select the cell C14 and enter the following formula:

=(C11+C13)*(1-C12)

  • Entering this formula will instantly calculate the Cost of Debt in cell C14.

Estimate Cost of Debt to Calculate Wacc in Excel

Read More: How to Calculate Time Weighted Return in Excel


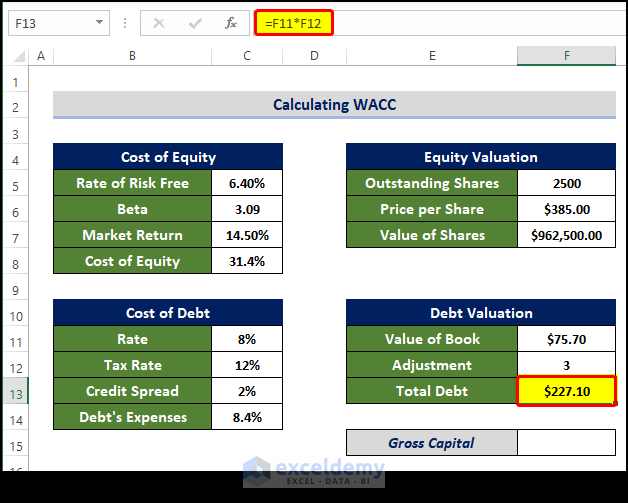
Step 5: Calculate the Market Valuation of Debt

Now that we have the necessary information, we can now determine the Market Valuation of Debt.

  • Now we are going to Evaluate the Cost of Debt using the parameters presented here.
  • To do this, select the cell C14 and enter the following formula:

=F11*F12

  • Entering this formula will instantly calculate the Cost of Debt in cell C14.

Calculate Market Valuation of Debt to Calculate Wacc in Excel


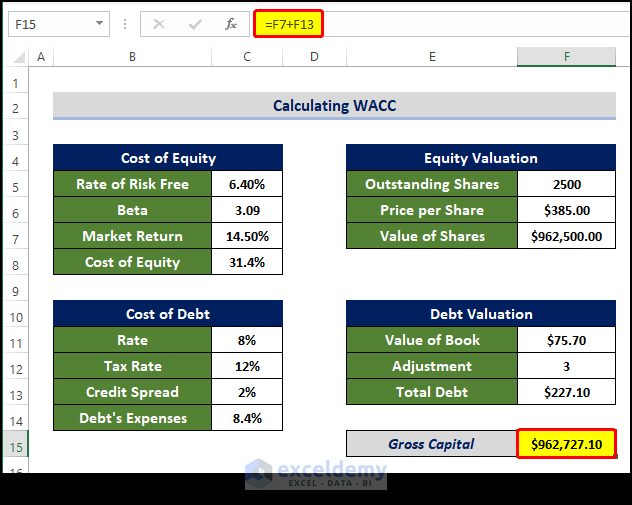
Step 6: Estimate Gross Capital

From the value of debt and equity, we can find the Gross Capital by summing them up.

  • Now we are going to evaluate the Total Capital using the parameters presented here.
  • To do this, select the cell F15 and enter the following formula:

=F7+F13

  • Entering this formula will instantly calculate the Total Capital in cell F15.


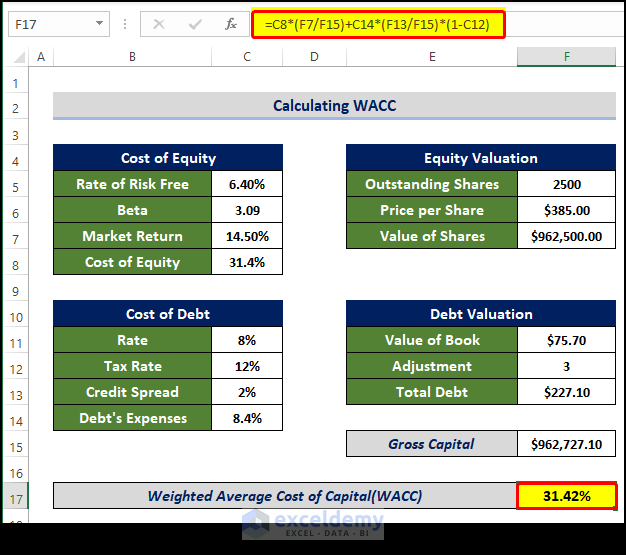
Step 7: Calculate WACC (Weighted Average Cost of Capital)

Now we have all the necessary parameters in order to calculate the WACC in Excel.

  • In order to calculate this, select cell F17 and enter the following:

=C8*(F7/F15)+C14*(F13/F15)*(1-C12)

  • This formula will directly calculate the WACC in cell F17.

Calculate WACC (Weighted Average Cost of Capital) to Calculate Wacc in Excel


Step 8: Interpret Outcome

The final value of the WACC we got is about around 31.42%. Which is quite high. We already know that the higher WACC compared to the expected return results in higher instability. This actually means that the business is paying much more for the capital than its earnings. Which results in a loss of assets.

  • In the example shown above, the WACC is 31.42%. We didn’t put any expected return on the business. Say, if the expected return is 15%, then we could say that the business is losing money at (31.42%-15%) or at a 16.42% rate. This venture is, therefore, more volatile for investment.
  • On the other hand, if the expected return is 35%, then we can say that the business is generating wealth at the (35%-31.42%) or 3.58% rate. This investment is preferable and safe for the investment.

💬 Things to Remember

Although WACC brings a lot to the table in terms of helping investors make a decision regarding investment, and for the owner to determine how the company is performing in the market, it still has some limitations.

  • The calculations seem pretty straightforward when all the parameters are in the sheet. But the reality is that determining parameters like equity, and debt is pretty difficult because they are being reported for various reasons on various occasion
  • WACC also assumes that the investing in the company, or the capital, will flow in the same way throughout the year. But this isn’t possible actually in most cases.

Download Practice Workbook

Download this practice workbook below.


Conclusion

In this article, we showed how you can calculate WACC in Excel with 8 separate steps with elaborate explanations.

For this problem, a macro-enabled workbook is available for download where you can practice these methods.

Feel free to ask any questions or feedback through the comment section.


Related Articles


<< Go Back to Excel Formulas for Finance | Excel for Finance | Learn Excel

Get FREE Advanced Excel Exercises with Solutions!
Rubayed Razib Suprov

Rubayed Razib, holding a BSC degree in Naval Architecture & Engineering from Bangladesh University of Engineering and Technology, serves as a devoted member of the ExcelDemy project. He has contributed significantly by authoring numerous articles and showcasing proficiency in VBA. Razib efficiently automates Excel challenges using VBA macros and actively participates in the ExcelDemy forum, providing valuable solutions for user interface challenges. Apart from creating Excel tutorials, he is interested in Data Analysis with MS Excel,... Read Full Bio

We will be happy to hear your thoughts

Leave a reply

Advanced Excel Exercises with Solutions PDF


ExcelDemy
Logo