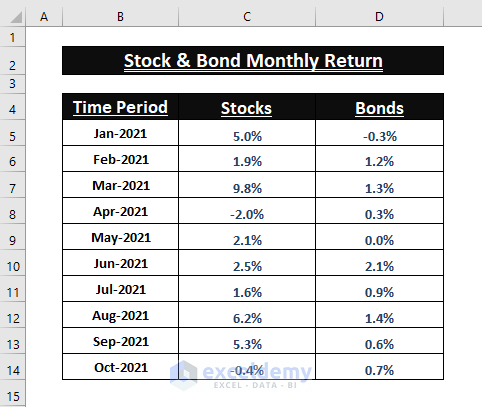
The dataset showcases the monthly return percentages of Stocks and Bonds.
What Is the Mahalanobis Distance?
The Mahalanobis Distance (DM) refers to the distance between a point and a distribution. It doesn’t mean the typical distance between two specific points. It’s the multivariate equivalent of the Euclidean distance. The Mahalanobis Distance (DM) is often used in Statistics applications. The formula to calculate the Mahalanobis Distance (DM) is:
![]()
In the formula:
X = the vector observation
µ = the vector Mean of the observations
S-1 = inverse Covariance matrix
Steps to Calculate Mahalanobis Distance in Excel
There are several components of the Mahalanobis Distance (DM) formula that need to be computed before calculating the Mahalanobis Distance (DM):
(i) Calculating Mean (µ)
(ii) Calculating Mean Difference (x-µ)
(iii) Finding Covariance Matrix (S)
(iv) Transposing the Mean Difference ((x-µ)T)
(v) Finding Inverse Covariance Matrix (1/S)
(vi) Multiplying Mean Difference (x-µ) and Inverse Covariance Matrix (1/S)
(vii) Multiplying all Mahalanobis Distance Components ((1/S)*(x-µ)*((x-µ)T)))
(viii) Mahalanobis Distance (DM) calculation
Calculating Mean (µ) from Values
- Find the Mean. Use the following formula in C15.
=SUM(C5:C14)/COUNT(C5:C14)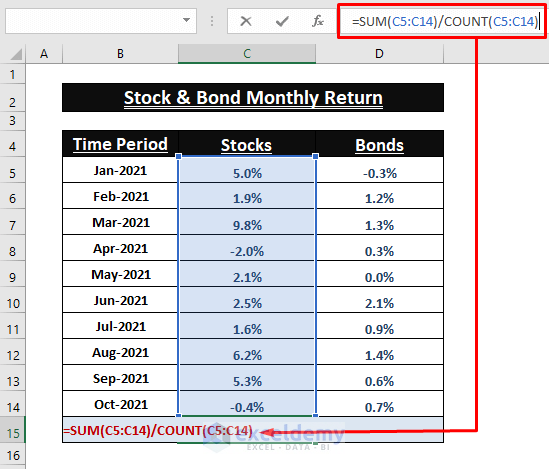
- Use the previous formula to find the Mean for Bonds (Column D).
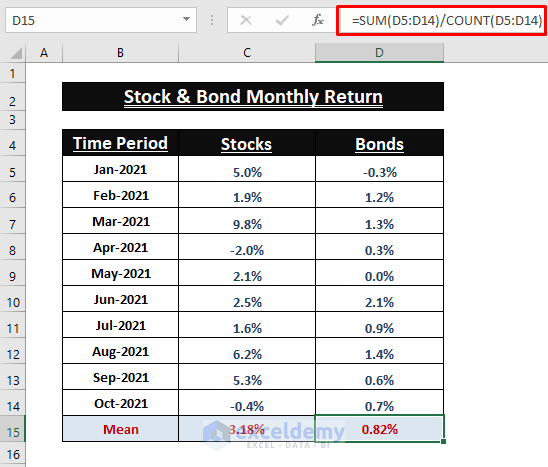
You can also use the AVERAGE function to find the Mean.
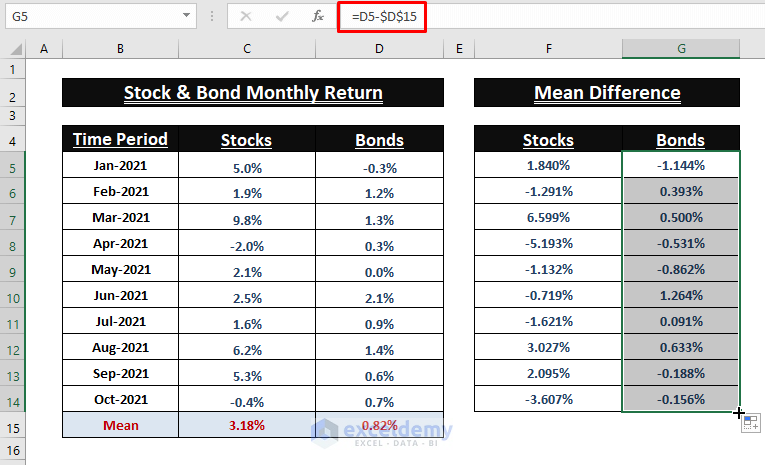
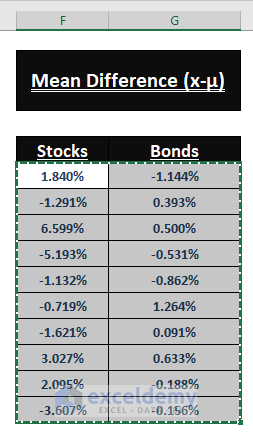
Calculating Mean Difference (x-µ) of Values
- Find the Mean Difference (x-µ) of individual entries. Enter the following formula in F5:
=C5-$C$15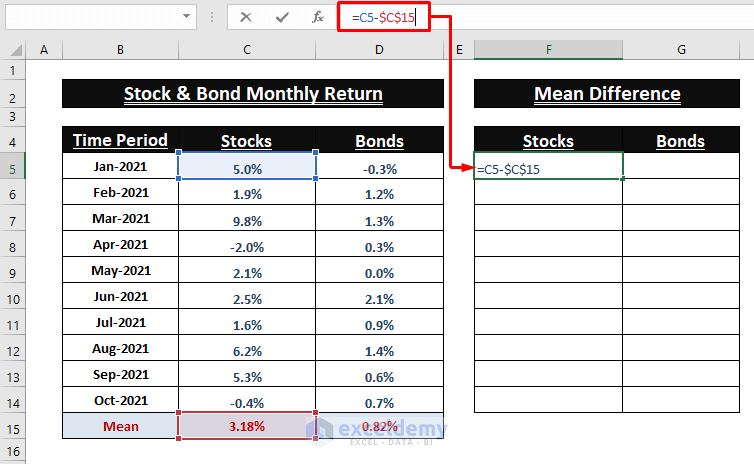
- Use the Fill Handle to apply the formula to the other cells.
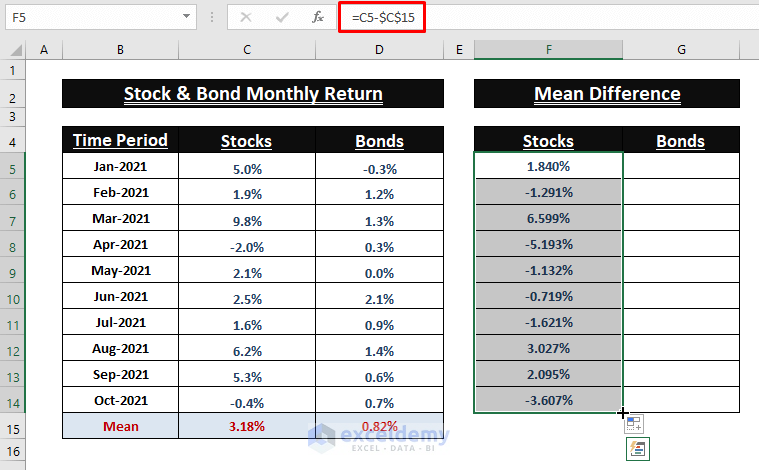
- Repeat the previous steps, using the same formula to find the Mean difference for Bonds (Column G).
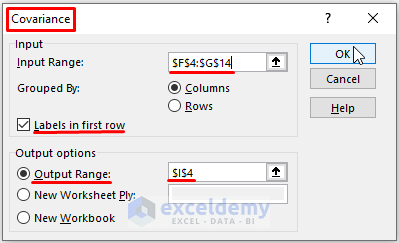
Finding the Covariance Matrix (S) by Using Data Analysis
- Go to the Data tab > in Analysis click Data Analysis.
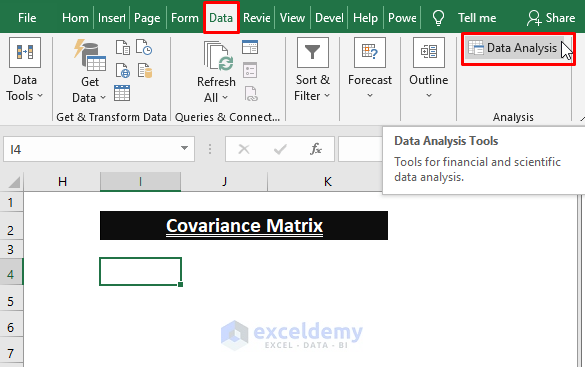
- In the Data Analysis window, choose Covariance.
- Click OK.
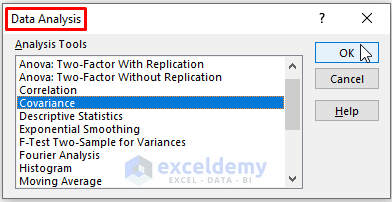
- In the Covariance dialog box, enter F4:G14 (Mean Difference Range) as Input Range, and I4 as Output Range.
- Check Labels in first row.
- Click OK.
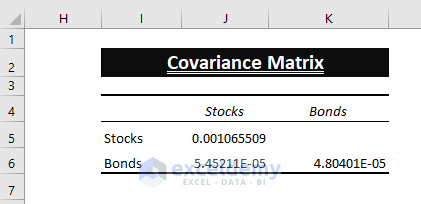
The Covariance Matrix(S) is displayed.
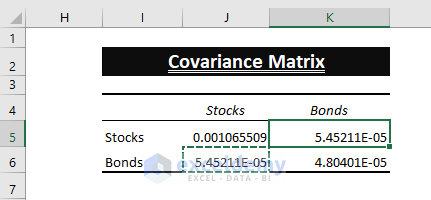
- Excel in-built doesn’t insert all the entries. Therefore, Copy (CTRL+C) and Paste (CTRL+V) J6 value in K5.
- Use the MINVERSE function to get the Inverse Covariance Matrix.
- Press CTRL+SHIFT+ENTER to enter the formula below. (Make sure the Covariance Matrix is a Square Matrix)
=MINVERSE(J5:K6)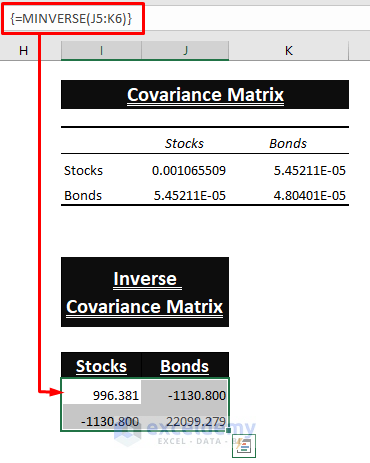
Transposing the Mean Difference Matrix ((x-µ)T)
- Use the Transpose function or Copy (CTRL+C) the Mean Difference (F5:G14).
- Select any range and right-click it.
- Click Transpose to insert the transposed Mean Difference Matrix (x-µ)T.
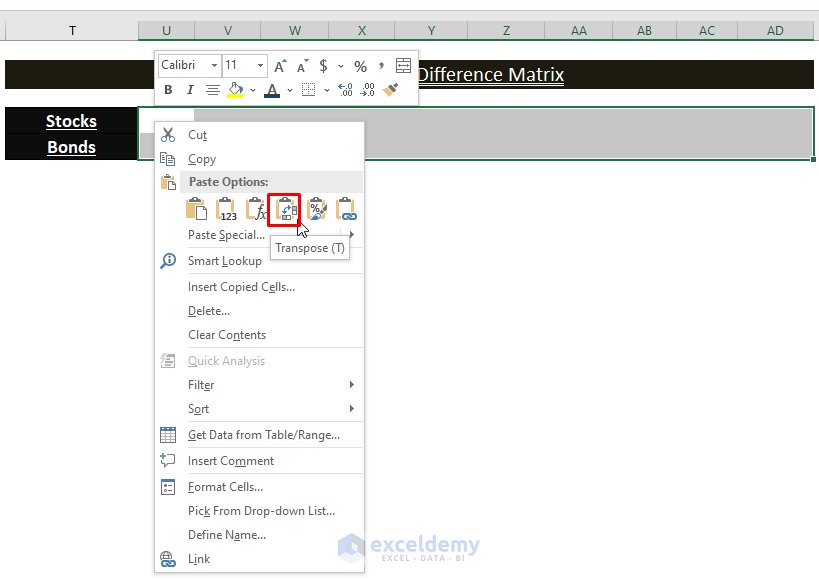
This is the output.

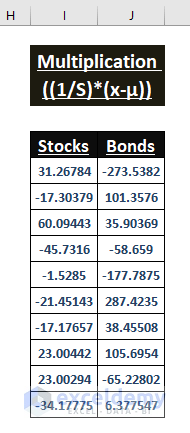
Multiplication of the Inverse Covariance Matrix (1/S) and Mean Difference (x-µ)
- Enter the following formula in I5.
=MMULT(F5:G14,L5:M6)The MMULT function array multiplies the given two arrays.
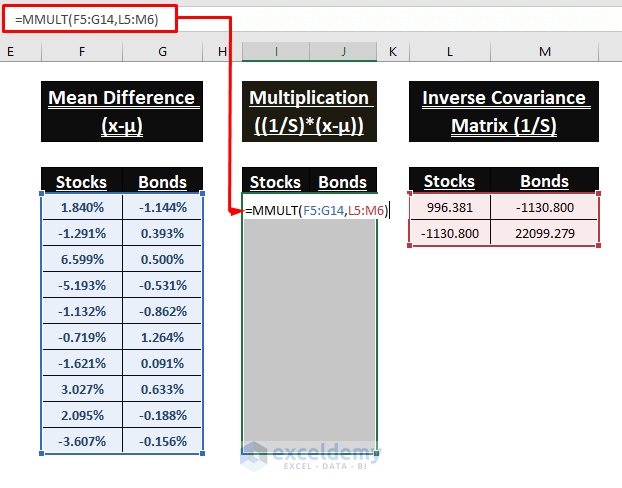
- This is an array formula. Use CTRL+SHIFT+ENTER to enter it.
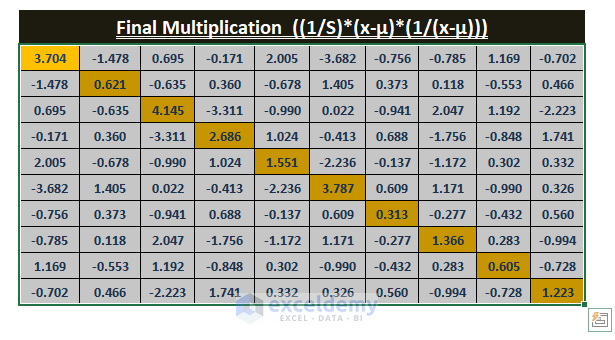
Multiplication of All Mahalanobis Distance Components ((1/S)*(x-µ)*((x-µ)T))
- Use the following formula in N8.
=MMULT(I5:J14,M4:V5)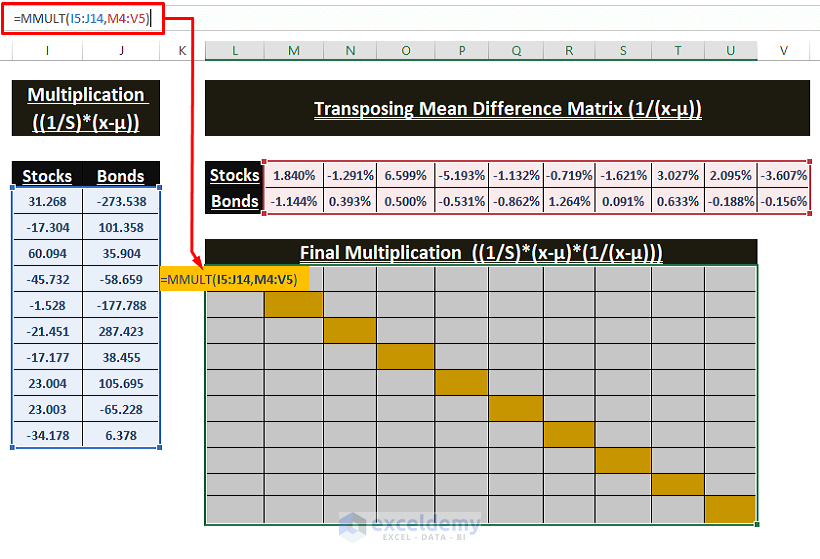
- Press CTRL+SHIFT+ENTER to apply the array formula.
This is the output.
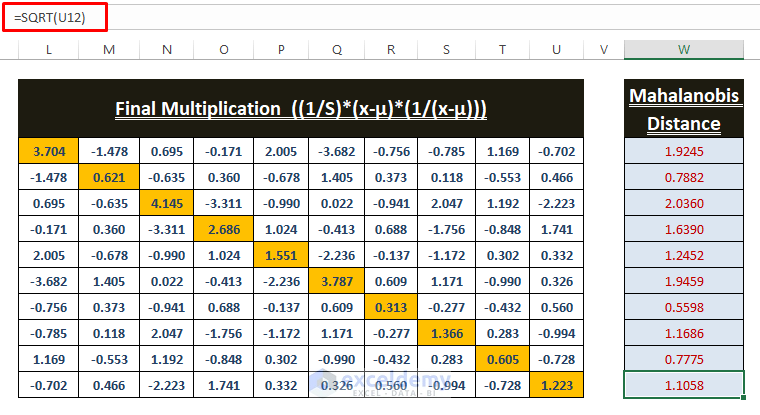
Calculation of the Mahalanobis Distance
- Enter the formula in W3 to find the distance.
=SQRT(L3)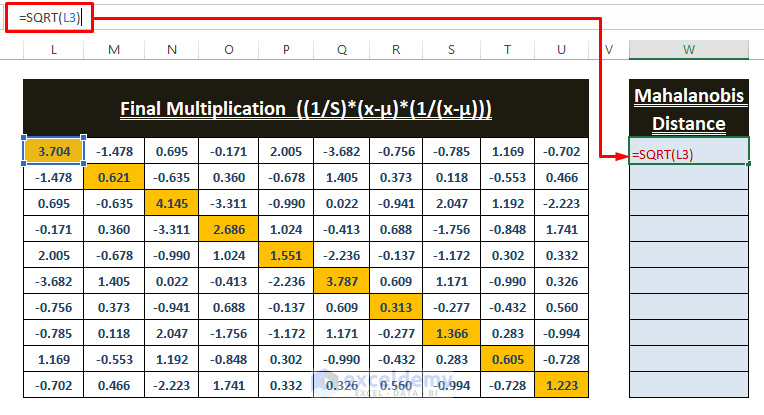
- Use the diagonal values to find the Mahalanobis Distances. Mahalanobis Distance results in #NUM! error if the final multiplication value displays a minus.
Download Excel Workbook
<< Go Back to Distance | Formula List | Learn Excel
Get FREE Advanced Excel Exercises with Solutions!

First class explanation – really well thought through and clearly explained.
Thank you for making it accessible to all.
Hello Marc,
You are most welcome. Thanks for your feedback and appreciation. Glad to hear that our clear explanation is helpful to you. We always try to make Excel content accessible to all.
Regards
ExcelDemy