In our personal and industrial financing, it is so much needed to forecast our profits and costs. But things may turn out differently from the forecast in reality. This difference can be calculated as variance which contributes as a significant factor in analyzing the company’s growth. In this article, I will show you all the steps to create Actual Vs. Budget Variance Reports in Excel.
What Is Actual Vs Budget Variance?
Variance is the difference between the budget amount and the actual amount for a particular month/year. Through this calculation, you can determine if a company is in profit or loss. You can also calculate the percentage variance by dividing the variance by the actual amount. So, the required formulas would be like:
Actual Variance = Actual – Forecast
Percentage Variance = (Variance / Actual) * 100%
Steps to Create Actual Vs Budget Variance Reports in Excel
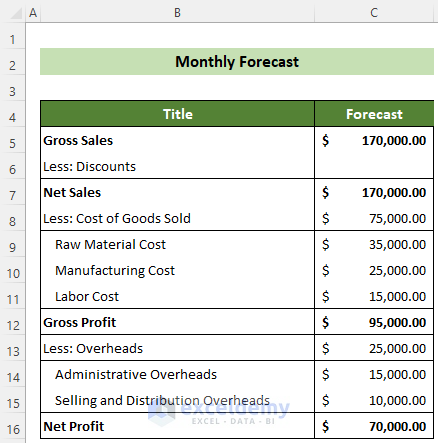
Say, we have a dataset of a company’s sales revenue and cost forecast.
In addition to this, we also have the actual sales revenue and cost for the company for a month in our hands.
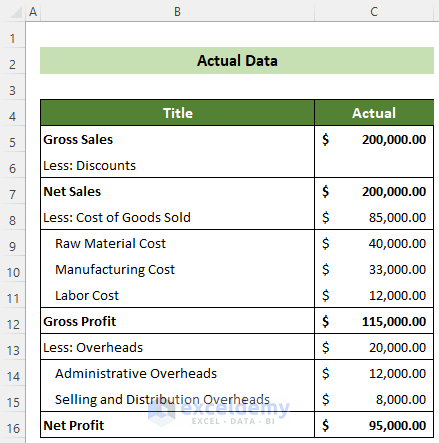
Now, we want to create an actual vs budget variance report in Excel from these given datasets. You can go through the following article to accomplish this target.
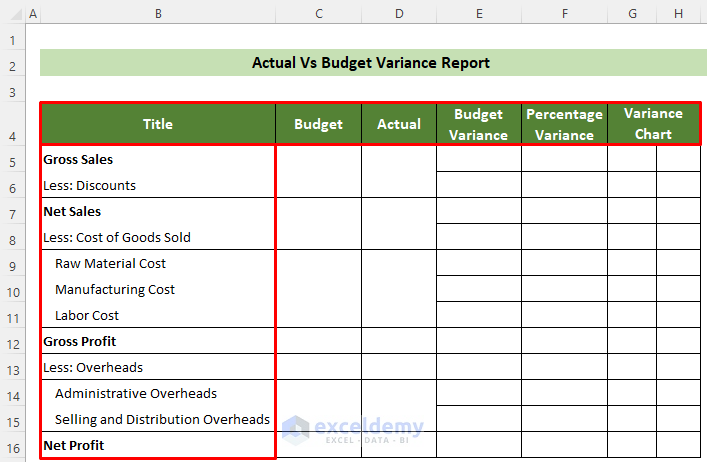
📌 Step 1: Prepare the Format of Actual Vs Budget Variance Report with Proper Dataset
First and foremost, you need to prepare your dataset for the actual vs budget variance report.
- To do this, at the very beginning, create a template of your Actual Vs. Budget Variance Report with necessary header columns and rows like the following figure.
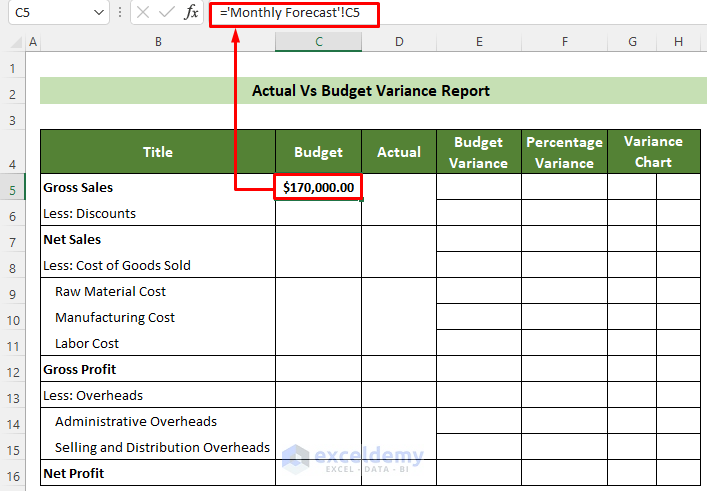
- Afterward, click on cell C5 and insert the following formula to insert value from your dataset properly.
='Monthly Forecast'!C5- Subsequently, press the Enter key.
- Following, place your cursor on the bottom right position of the cell.
- Subsequently, drag the appeared to fill handle below to copy the same formula for all the cells below.
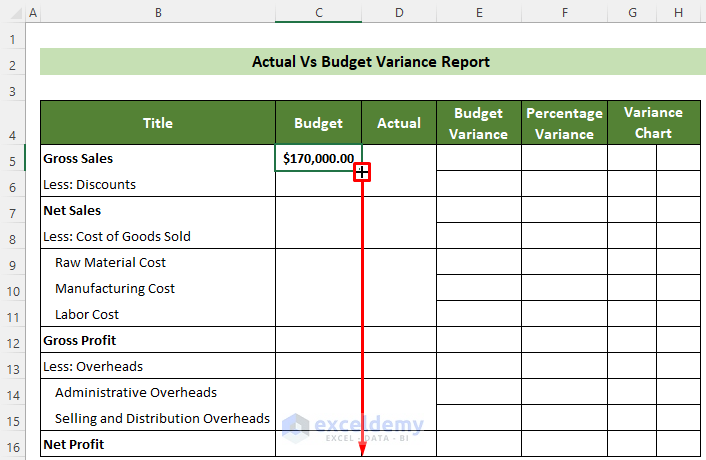
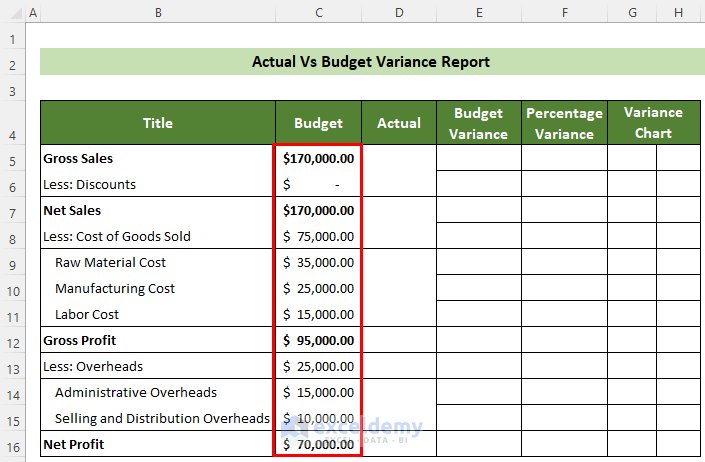
- Thus, you will get all the budget data from your forecast dataset in column C.
- At this time, click on cell D5 and insert the following formula.
='Actual Data'!C5- Subsequently, hit the Enter key.
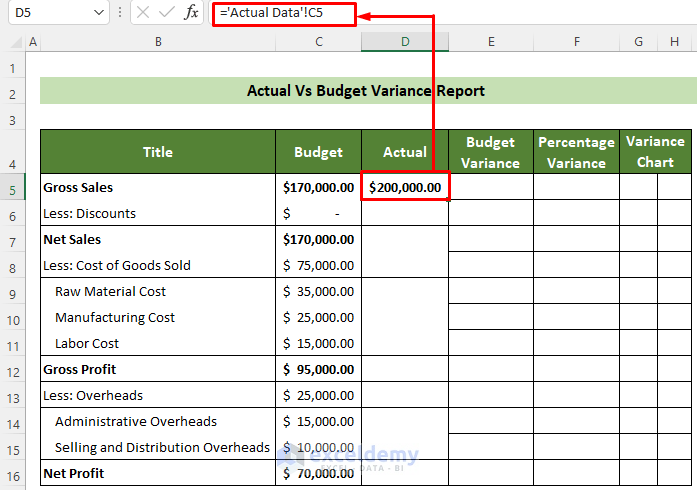
- As a result, you will get the actual data inserted in your report accurately.
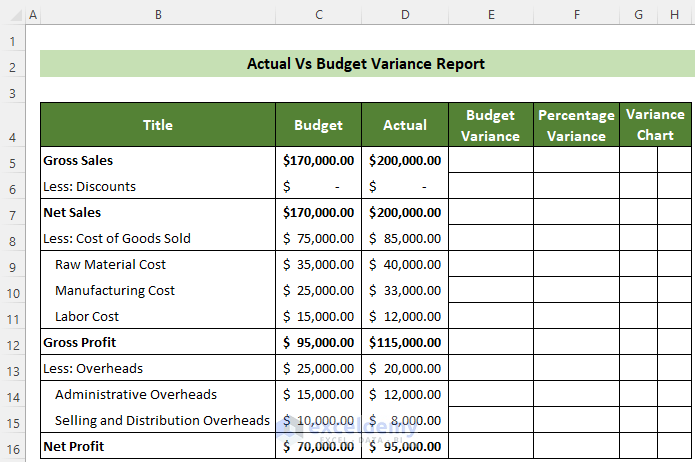
Thus, the formatting of the Actual Vs. budget Variance Report is done.
Read More: How to Prepare a Sales Budget with Example in Excel
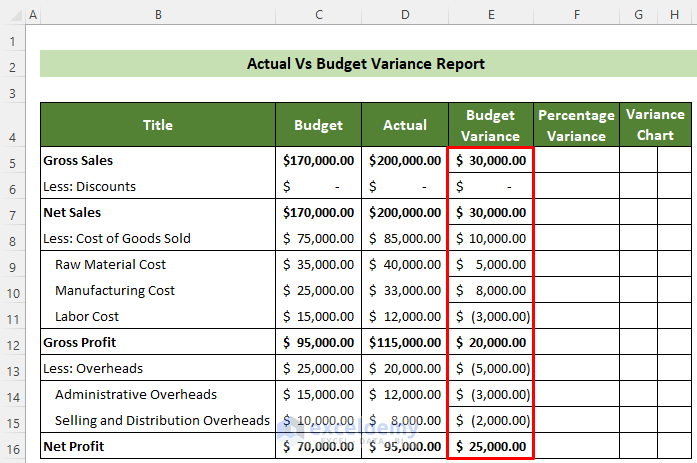
📌 Step 2: Calculate Actual Variance
The next step is to use the formulas to calculate the actual variance of your dataset.
- To do this, first click on cell E5.
- Subsequently, insert the following formula and hit the Enter key.
=D5-C5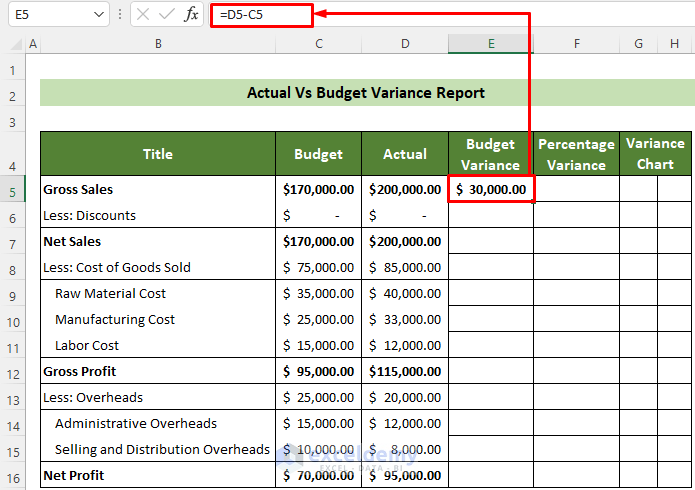
- Consequently, you will get the first data’s variance.
- Now, place your cursor in the bottom right position of the cell.
- Subsequently, drag the fill handle below upon its appearance.
As a result, you will get all the actual variances for your dataset successfully.
Read More: How to Create Budget and Expense Tracker in Excel
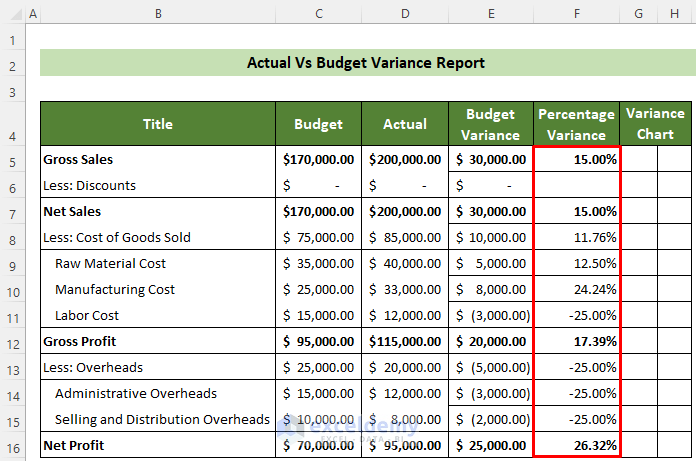
📌 Step 3: Calculate Percentage Variance
Now, you need to calculate the percentage variance for your dataset.
- To do this, initially, click on cell F5 and insert the following formula.
=E5/D5- Subsequently, hit the Enter key.
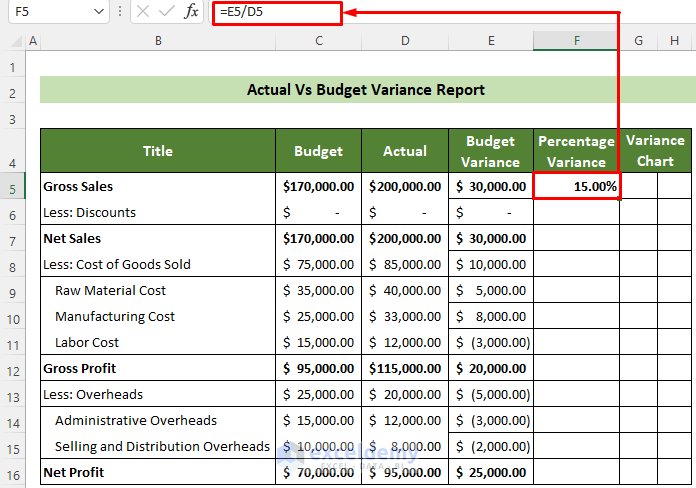
- Afterward, use the fill handle feature to copy the same formula dynamically for all the other cells below.
Consequently, you will get all the percentage variances of your dataset in the Actual Vs. Budget Variance Report.
Read More: How to Create a Budget with Irregular Income in Excel
📌 Step 4: Create a Budget Vs Actual Variance Chart and Finalise Report
Now, for better visualization and analysis, it is very helpful if you add some charts depicting your dataset summary in the report
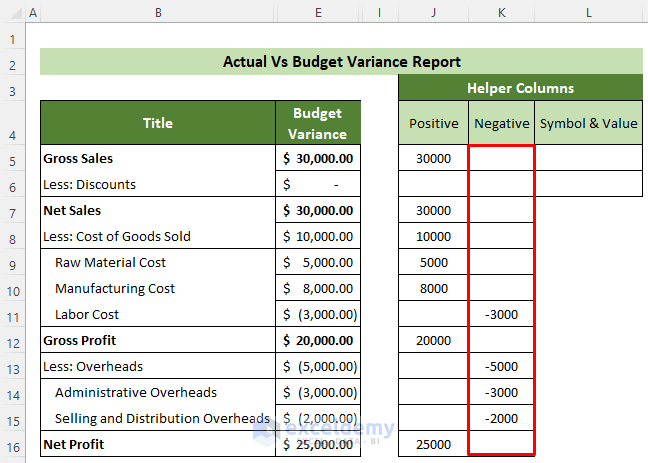
- In order to do this, first, create three helper columns named Positive, Negative, and Symbol & Value.
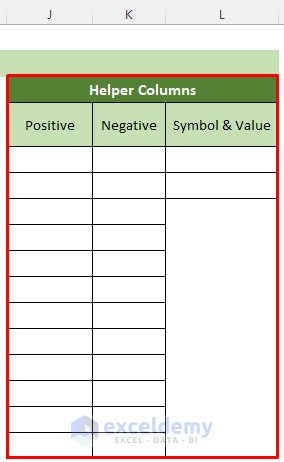
- Here, the Positive column will carry the positive values of the actual variances and the Negative column will carry the negative data of the actual variances.
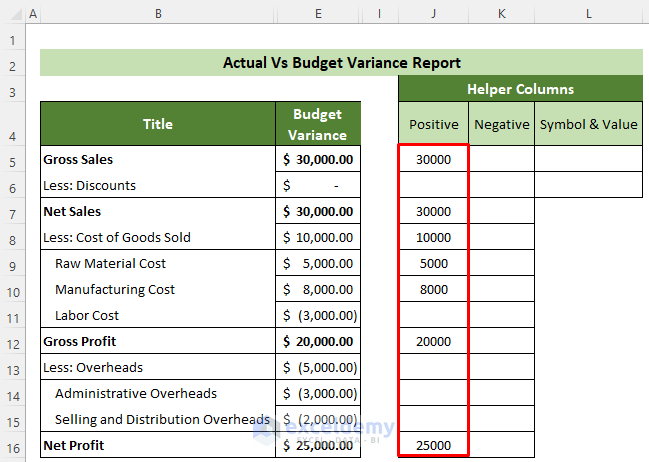
- Now, click on cell J5 and insert the following formula.
=IF(E5>0,E5,"")- Subsequently, hit the Enter key.
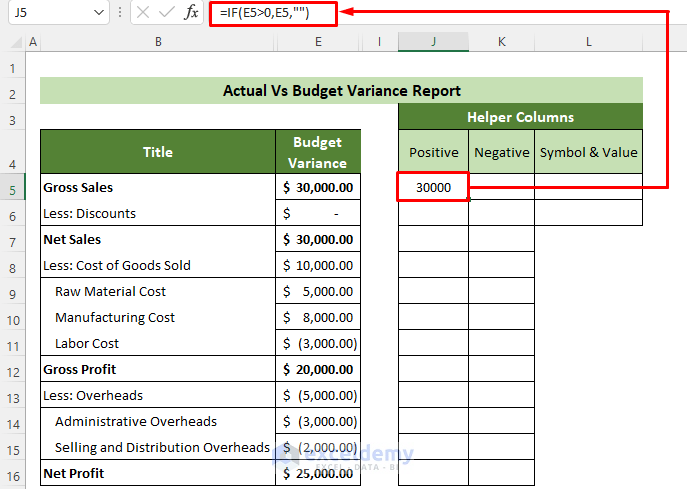
- Afterward, use the fill handle feature to copy the same formula for all the other data below and get the positive values shown in column J.
- Afterward, click on cell K5 and insert the formula below.
=IF(E5<0,E5,"")- Following, hit the Enter key.
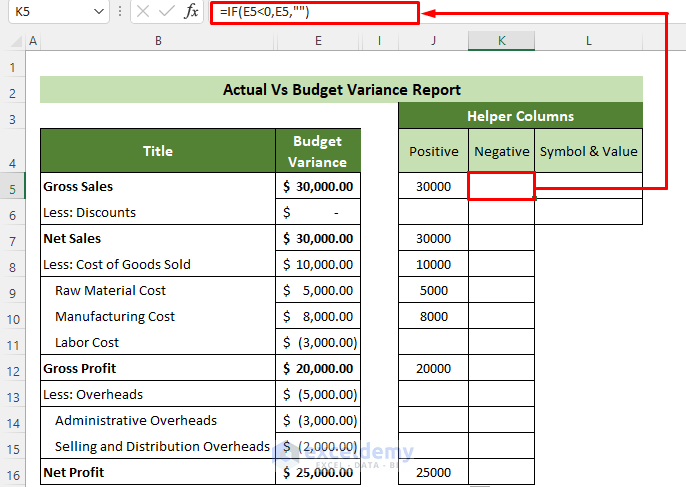
- Next, use the fill handle feature again to fill the data through column K perfectly as per the E column data.
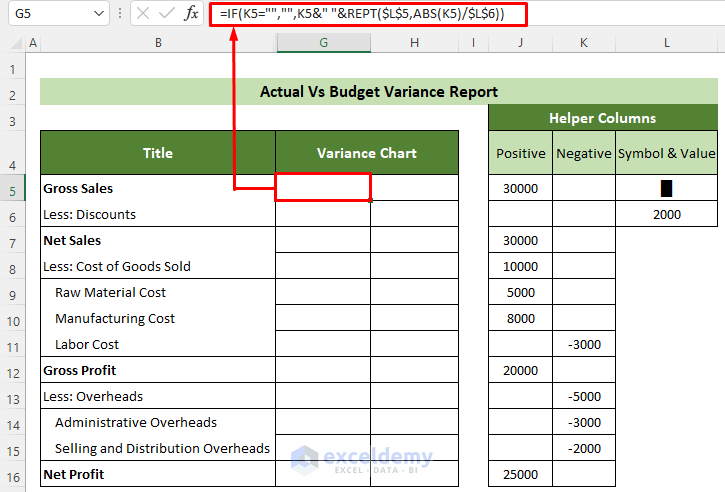
- Afterward, click on cell L5 >> go to the Insert tab >> Symbols group >> Symbol option.
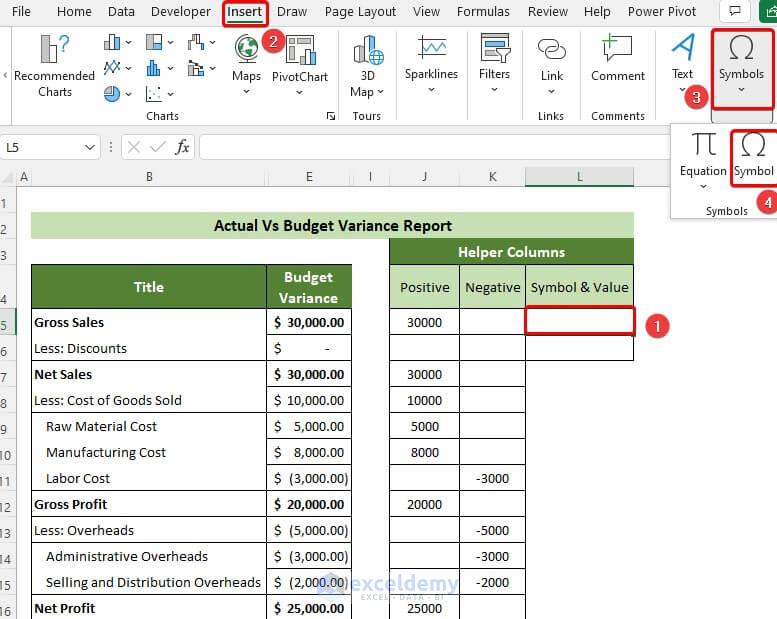
- As a result, the Symbol dialogue box will appear.
- Following, choose the option Unicode (hex) from the from: option list.
- Subsequently, choose the Subset: option as Block Elements >> choose the Full Block symbol >> click on the Insert button.
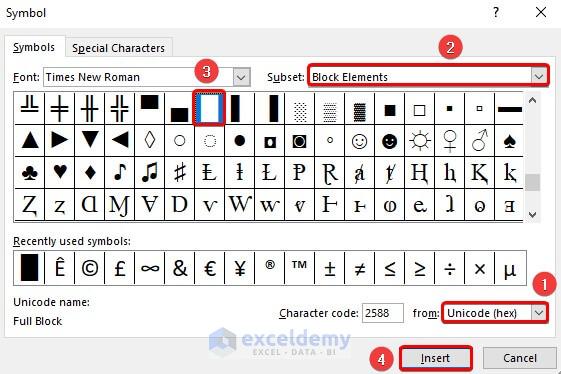
- As a result, the symbol will be inserted.
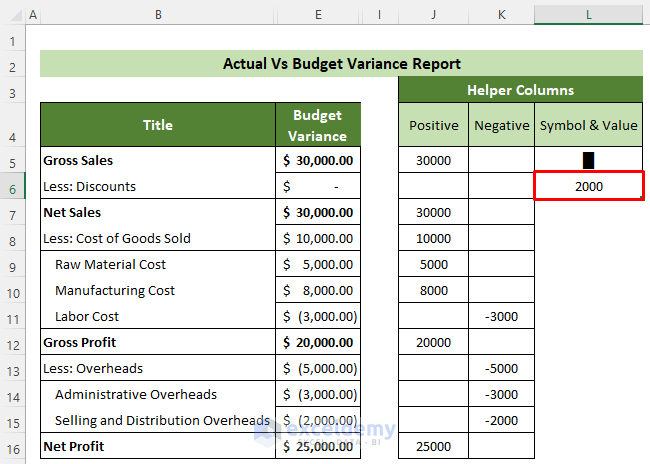
- Afterward, write 2000 in cell L6.
- Now, click on cell G5 and insert the formula below.
=IF(K5="","",K5&" "&REPT($L$5,ABS(K5)/$L$6))- Subsequently, press the Enter key.
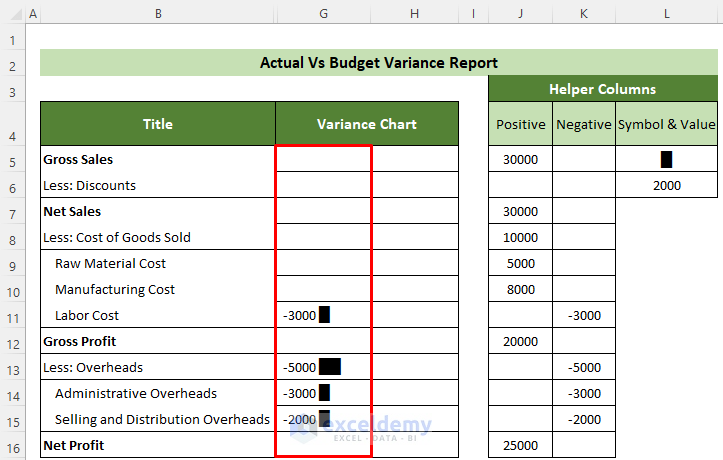
- Afterward, place your cursor in the bottom right position of the cell.
- Subsequently, drag the fill handle below upon its appearance.
- Thus, you will get the relative horizontal charts for the negative variances.
- Afterward, click on cell H5 and insert the following formula.
=IF(J5="","",J5&" "&REPT($L$5,ABS(J5)/$L$6))- Subsequently, hit the Enter key.
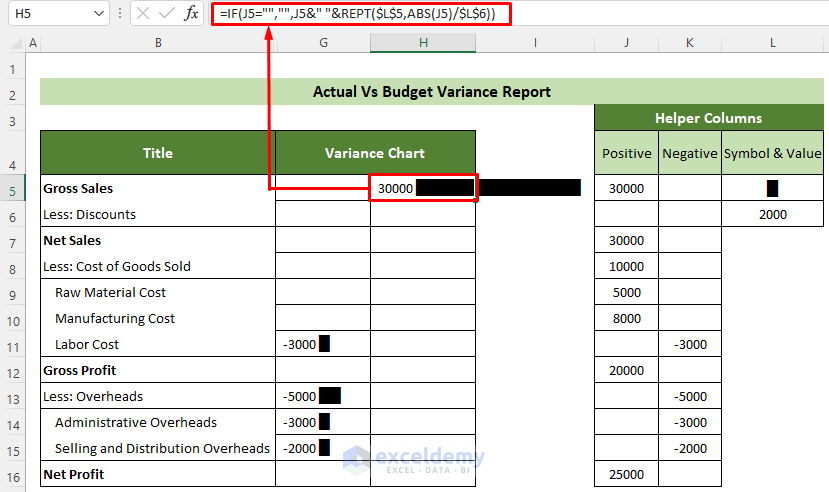
- As a result, you will get the positive variance chart for the first data.
- Afterward, use the fill handle feature downward to get all the positive variances of your whole dataset.
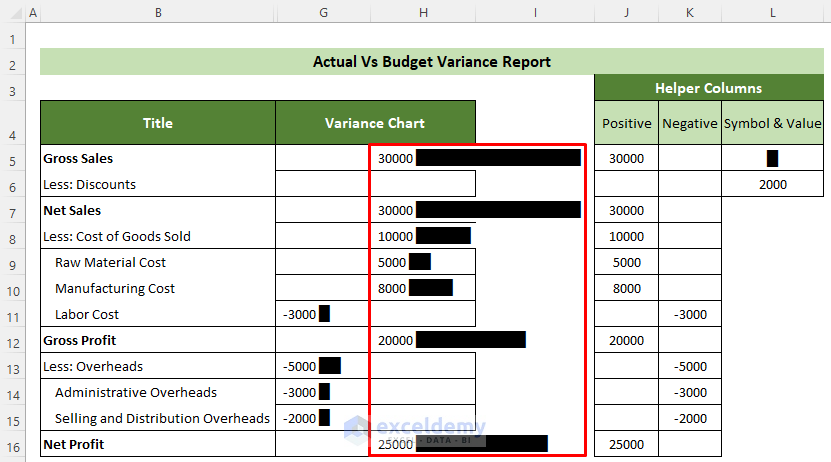
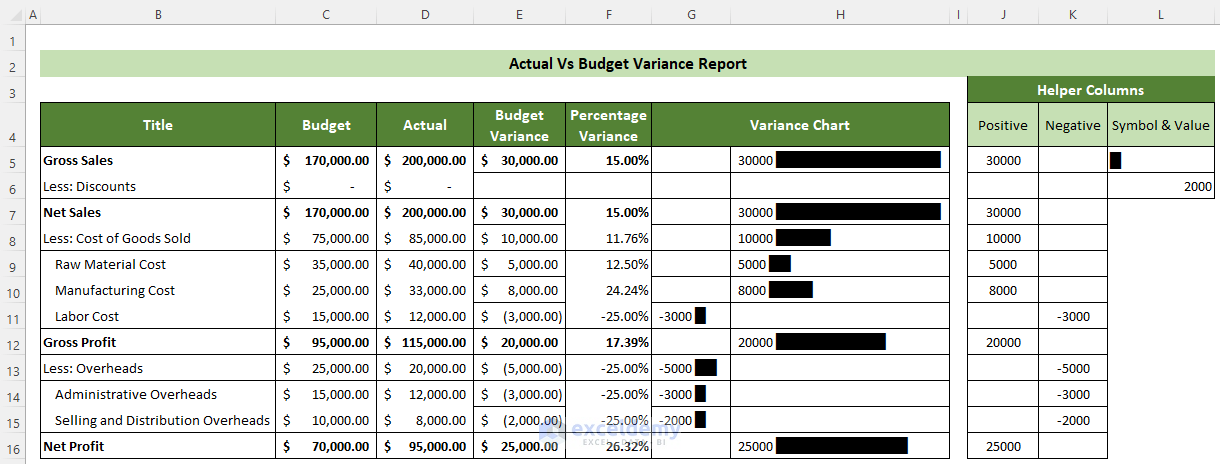
Thus, your Actual Vs Budget Variance Report is ready in Excel. And, the final outlook of the report should look like this.
Read More: How to Create a 50-30-20 Budget Spreadsheet in Excel
Download Sample Report
You can download our practice workbook from here for free!
Conclusion
So, in this article, I have shown you all the steps to create Actual Vs. Budget variance Reports in Excel. Read the full article carefully and practice accordingly. I hope you find this article helpful and informative. You are very welcome to comment here if you have any further questions or recommendations.
Thank you!
Related Articles
- How to Create Bi Weekly Budget in Excel
- How to Create Uncertainty Budget in Excel
- How to Create Renovation Budget in Excel
- How to Prepare a Vacation Budget in Excel
- Create Retirement Budget Worksheet in Excel
- How to Make Food and Beverage Budget in Excel
<< Go Back to Budget Template | Finance Template | Excel Templates
Get FREE Advanced Excel Exercises with Solutions!
