Microsoft Excel is a handy software. We use Excel functions for our educational, business, and other daily measurements. And, every measurement parameter needs a powerful uncertainty budget to support the scope of accreditations. With this in mind, we will start from scratch and show you step-by-step procedures to prepare an uncertainty budget in Excel.
What Is Uncertainty Budget?
A statement of measurement uncertainty, as well as their calculation and combination, is known as an uncertainty budget. In essence, it is a document that outlines our process for estimating measurement uncertainty, including the steps and calculations. A typical uncertainty budget includes:
- Model for measurement
- Estimation
- Variable uncertainty in the measurement model
- Covariances
- Distributions of probabilities
- Freedom of Degrees
- Type of Uncertainty Source
It is always better to err on the side of providing too much information when reporting the result of a measurement and its uncertainty than it is to provide insufficient information. This is true even though in practice the amount of information required to document a measurement result depends on its intended use.
Step-by-Step Procedure to Create Uncertainty Budget in Excel
It can be challenging to estimate uncertainty, especially if we are just starting out. An uncertainty budget or calculator, for example, can considerably help. In this article, we will cover:
- An uncertainty budget in Excel
- Include tools to calculate uncertainty automatically
- Check that your uncertainty calculator works as intended
To demonstrate, we take a dataset that represents the source of uncertainty.
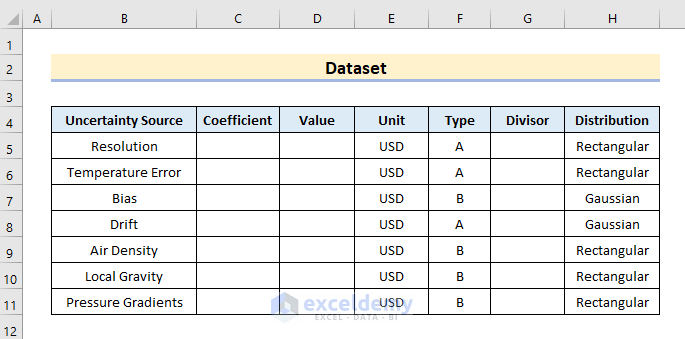
Step 1: Populate Dataset with Necessary Components
Budgets for uncertainty are crucial because they give specific instructions on how to calculate uncertainty. You, therefore, need a budget for uncertainty in detail to assist you in explaining to others how you determined uncertainty. As you can see, I employ columns to convey crucial information about each contributor while rows are used to list each uncertainty contributor. This makes it simple to maintain an orderly and consistent uncertainty budget. You should think about including the following components in your uncertainty budgets in order to calculate uncertainty efficiently.
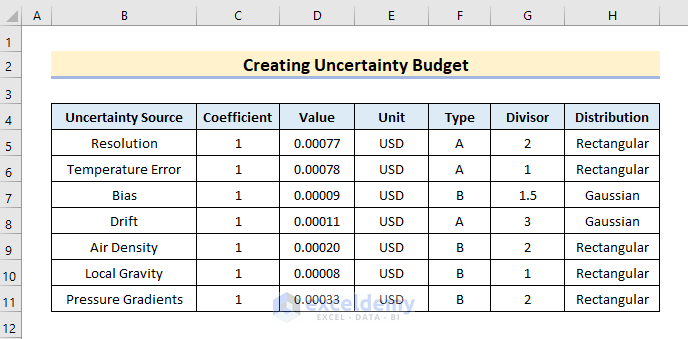
- Source of Uncertainty
I like to utilize columns to specify each uncertainty source’s parameters and rows to list my sources of uncertainty in my budgets.
- Sensitivity Co-efficient
To describe the rate of change in a performance measure with respect to the change in a design variable, the terms sensitivity, sensitivity coefficient, and gradient are interchangeable.
- Value of Uncertainty
We calculate the value of uncertainty by taking one-half the unit of the last decimal point in the measurement.
- Measurement Unit
To illustrate, let’s take the unit as USD.
- Type of Uncertainty
Here, we categorize the uncertainty type between A & B.
- Distribution of Probabilities
We include 2 probability distributions namely Rectangular & Gaussian. The rectangular distribution function represents a continuous uniform distribution with constant probability. On the other hand, the Gaussian Distribution shows frequent occurrences of the near mean values.
- Divisor
The divisor in the uncertainty budget refers to the account for how several probability distributions contribute differently to the total uncertainty.
Read More: How to Prepare a Sales Budget with Example in Excel
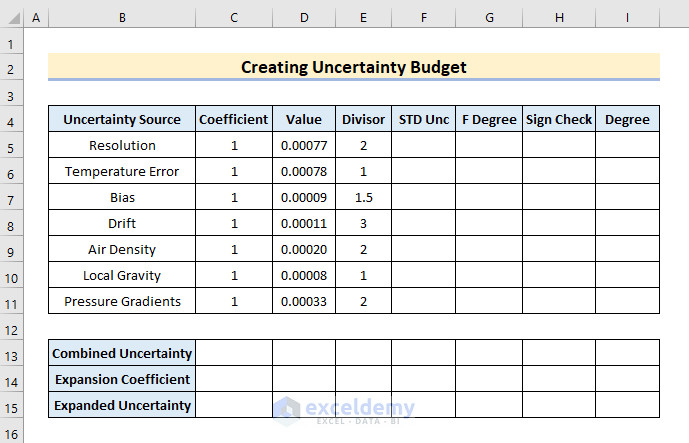
Step 2: Introduce Required Operations for Budget Calculation
Now, we add functions and formulas to the table we made for the uncertainty budgets in order to show how to create an uncertainty budget in Excel. The procedure for assessing uncertainty will become more automated as a result of the addition of these formulas. The budget will develop into a calculator that uses our input numbers to determine uncertainty automatically.
Add 5 following operations in your dataset.
- Standard Uncertainty
- Combined Uncertainty
- Expanded Uncertainty
- Effective Degrees of Freedom
- Significance Check
Read More: How to Create Actual Vs Budget Variance Reports in Excel
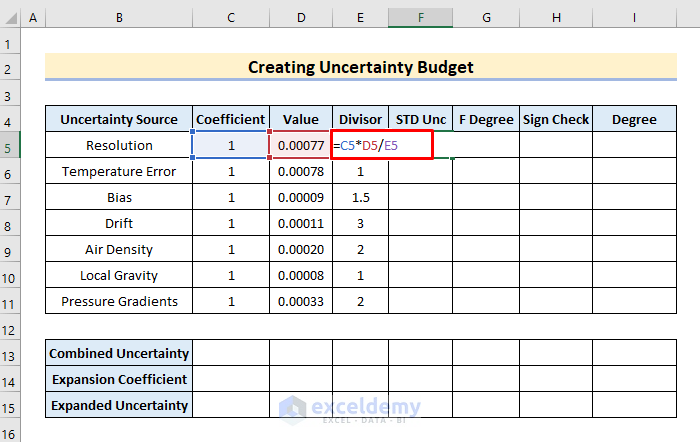
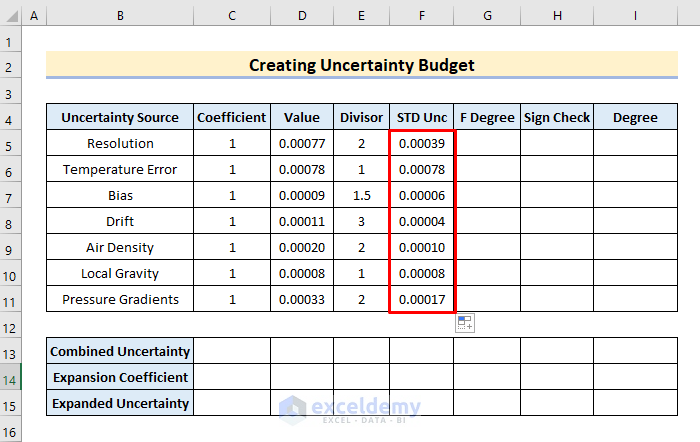
Step 3: Determine Standard Uncertainty
It’s rather simple to calculate standard uncertainty, and we may quickly add this feature to our uncertainty calculator. Simply multiply the uncertainty component by the corresponding sensitivity coefficient, then divide the result by the corresponding divisor (it is based on the probability distribution given to the uncertainty component). The equation of Standard Uncertainty is,
![]()
Now, let’s follow the steps to calculate using Excel functions.
- First, in cell F5, type the formula:
=C5*D5/E5- Next, press the Enter or Tab keys to get the value in F5.
- Afterward, AutoFill the rest of the cells by dragging the F5 cell down.
- As a result, we obtain the standard uncertainty value.
Step 4: Sum up Combined Uncertainty
The root sum of the square technique does a good job of determining combined uncertainty.
We will now demonstrate how to quickly compute combined uncertainty using only two Excel functions. The SQRT function returns the square roots of one or multiple numbers. The SUMSQ function returns the summation of the square roots of an array. Let’s see some easy procedures to implement these functions perfectly.
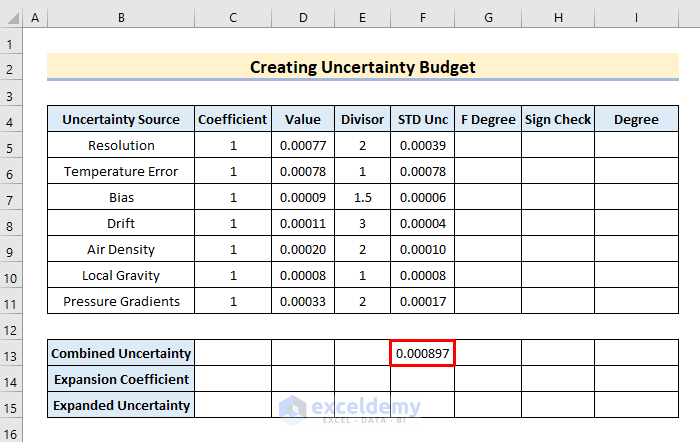
- Firstly, in cell F13, type the formula to compute the combined uncertainty.
=SQRT(SUMSQ(F5:F11))- After that, hit the Enter key.
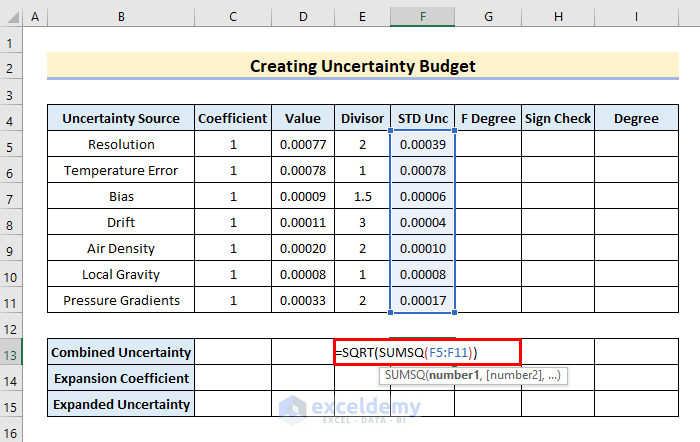
- Consequently, the combined uncertainty value appears in the dataset.
🔍 How Does the Formula Work?
SQRT returns the square root of the range F5:F11.
(SUMSQ(F5:F11)) returns the sum of the obtained square roots.
Read More: How to Create Budget and Expense Tracker in Excel
Step 5: Adjust Expanded Uncertainty
Calculating the extended uncertainty is the final step in evaluating measurement uncertainty.
To get the necessary confidence interval, multiply your total uncertainty by a coverage factor (also known as an expansion coefficient). The majority of individuals typically strive for a 95% confidence level when calculating uncertainty. We’ll use 1.97 (or 95.5%) as a coverage factor to achieve this. Follow the steps carefully.
- To begin with, write the formula in the cell F15,
=F13*F14- Later, tap the Enter or Tab key to do the multiplication.
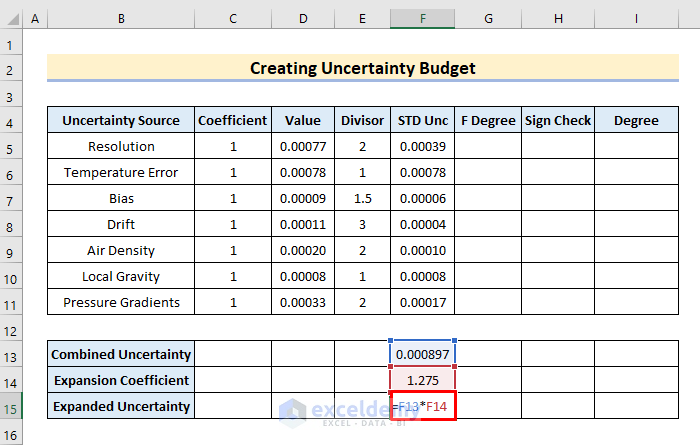
- Hence, the value of expanded uncertainty pops up in F15.

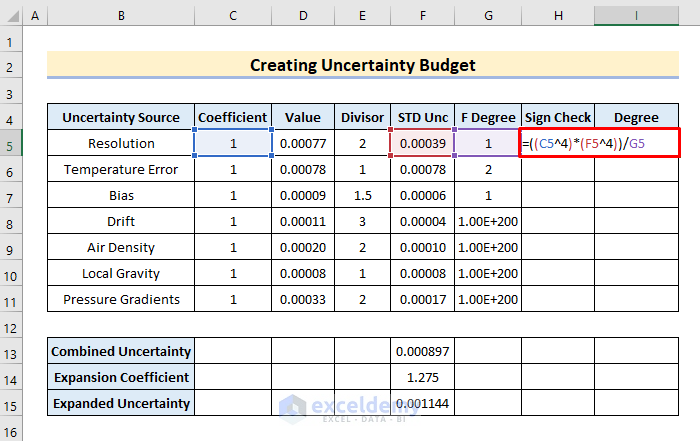
Step 6: Figure out Effective Degrees of Freedom
We will apply the Welch-Satterthwaite approximation equation to determine the effective degrees of freedom. But in order to calculate this value, you need to utilize a long string of functions, which can be very troublesome if you make mistakes or need to update the formula. The worst aspect was that most of the functions required manual entry. It took a lot of time. So, in order to reduce the amount of work needed to determine the effective degrees of freedom, we decided to divide the function into sub-functions. We start by solving the equation’s first half for each row’s corresponding uncertainty source. As a result, We are able to do the majority of the computations using the SUM function. Carefully, see some steps.
- First, in cell I5, type:
=((C5^4)*(F5^4))/G5- Next, press the Enter button.
- Then, drag the I5 cell down to AutoFill the rest of the array.
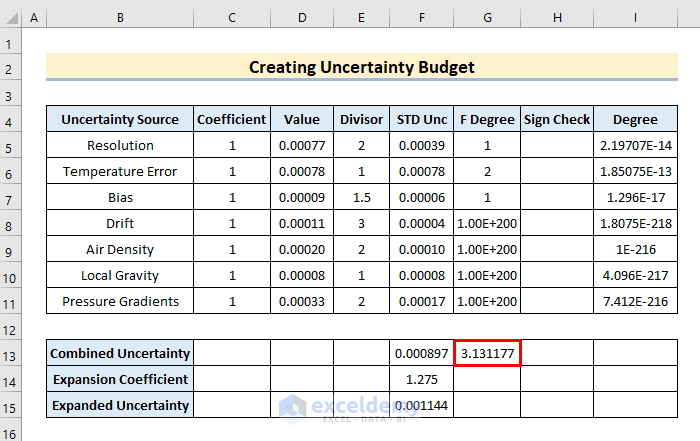
- Subsequently, the values appear in column I.

- Meanwhile, in cell G13, write the formula,
=(F13^4)/(SUM(I5:I11))- Lastly, hit the Enter or Tab keys again.

- Thus, the combined freedom of degree pops up.
Read More: How to Create a 50-30-20 Budget Spreadsheet in Excel
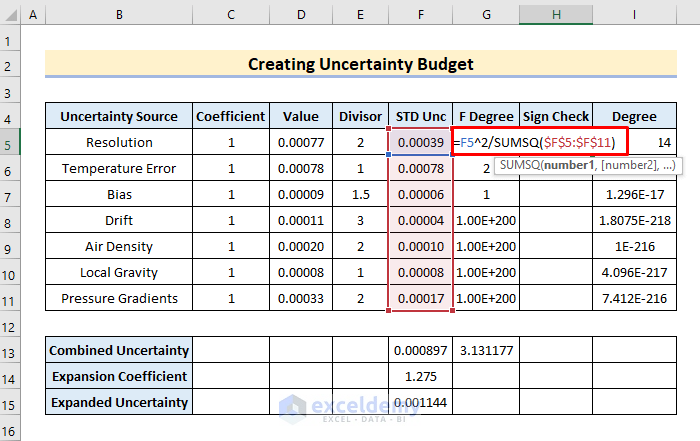
Step 7: Count up Significance of Each Uncertainty Component
It’s crucial to understand the importance of each uncertainty source and how much of an impact it has on your measurement. We can target and decrease the magnitude of the main contributors after we know which uncertainty components contribute the most. Furthermore, we will find the value by using the SUMSQ function again. Follow the procedure.
- In the beginning, add the SUMSQ formula to cell H5,
=F5^2/SUMSQ($F$5:$F$11)- Later, tap Enter key.
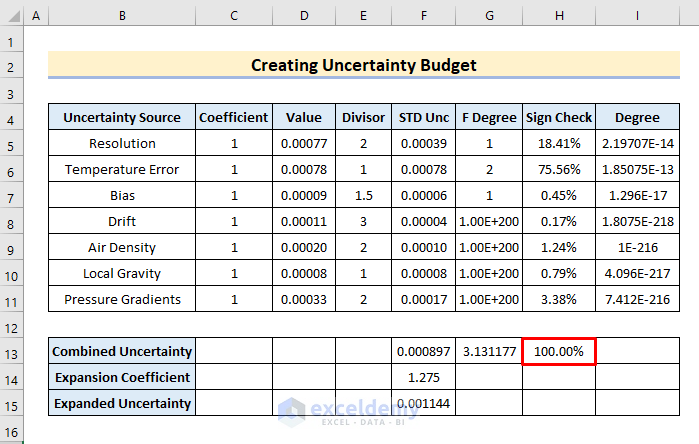
- After getting the value in H5, AutoFill to get the other values.
- Therefore, the values appear in column H.

- In the final section, we will use the SUM To do so, write
=SUM(H5:H11)- Now, press the Enter button.

- Thus, the combined significant check pops up in H13.
Step 8: Pin Important Notes to Excel Cells
It’s crucial to include notes in our uncertainty budgets. It will make it easier for us and our examiner to comprehend how we calculated measurement uncertainty. It’s a common mistake for people to overlook adding notes. Today we might recollect how we calculated measurement uncertainty, but a few months from now when we need to revise our calculations or explain the findings to an auditor, it will be more difficult to remember the specifics. Therefore, to add notes, follow the procedure.
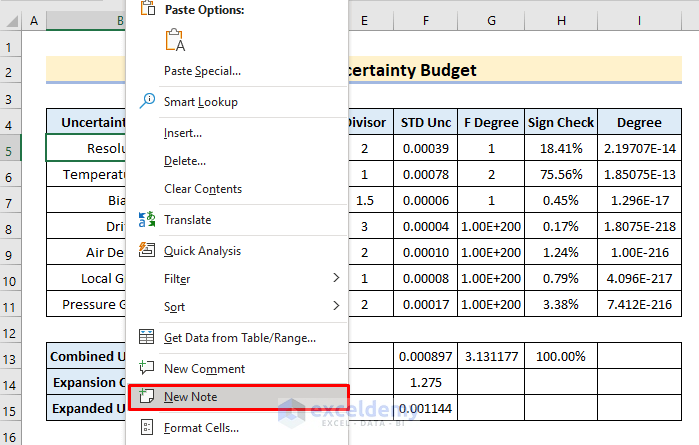
- Firstly, right-click on cell B5.
- Subsequently, a context menu will appear.
- Here, select New Note.
- As a result, a note box will pop up.
- There, include the data type A, Rectangular as the distributor, and USD as the unit.

- Alternatively, in B7, input B as the data type, Gaussian as the distributor, and USD as a unit.

- Similarly, pin notes to all the sources.

Step 9: Analyze the Budget
This is crucial for verification. When assessors inquire as to whether or not we have validated our uncertainty calculator, it benefits more than simply our own sanity. Some assessors prefer to claim that it is essential as part of the software validation process. Nevertheless, it isn’t.
We are not developing software to reduce measurement uncertainty. Microsoft Excel is being used as a calculator instead. This does not exclude you from verifying that our uncertainty budget calculator functions properly, though. Consider the uncertainty budget to be in good working order if the comparison produces comparable findings. Otherwise, check the functions for mistakes. After that, fix the mistakes and perform the verification process again.
To verify, keep in mind to
- Use a scientific calculator.
- Verify in the presence of a third party.
Download Practice Workbook
Download this practice workbook to exercise while you are reading this article. It contains all the datasets in different spreadsheets for a clear understanding. Try it yourself while you go through the step-by-step process.
Conclusion
In conclusion, we have discussed some easy steps to create an uncertainty budget in Excel. Please leave any further queries or recommendations in the comment box below.
Related Articles
- How to Create Bi Weekly Budget in Excel
- How to Make Food and Beverage Budget in Excel
- How to Create a Budget with Irregular Income in Excel
- How to Prepare a Vacation Budget in Excel
- How to Create Renovation Budget in Excel
- Create Retirement Budget Worksheet in Excel
<< Go Back to Budget Template | Finance Template | Excel Templates
Get FREE Advanced Excel Exercises with Solutions!
