
Excel is a powerful tool for data analysis, but it also offers add-ins that can transform it into a creative playground for data enthusiasts. With the right add-ins, you can unlock new powers — transforming messy datasets, building interactive dashboards, and turning numbers into visuals that wow your audience.
In this article, we discuss seven must-try Excel add-ins for the creative data enthusiast.
1. Power Query (Get & Transform Data)
Power Query is Excel’s ETL (extract, transform, load) engine for importing, cleaning, merging, and reshaping data without using VBA.
- Imports data from multiple sources (web, CSV, databases, Excel files)
- Cleans and reshapes data with point-and-click actions
- Merges or appends tables into one dataset
- Automates repetitive data-cleaning steps with reusable queries
Example: Combine sales data from multiple months into one master table automatically.
Steps to Use:
- Go to the Data tab >> select Get Data and choose your source.
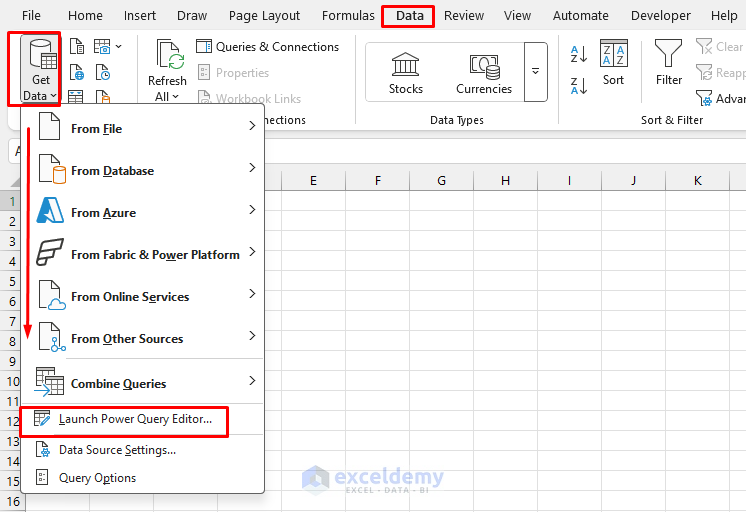
- Excel opens the Power Query window automatically.

Tip: Power Query used to be a downloadable add-in (for Excel 2010–2013). Today, it’s fully integrated in Excel under Data > Get & Transform Data.
2. Analysis ToolPak (Or XLMiner Analysis ToolPak for Mac)
The Analysis ToolPak adds advanced statistics and engineering tools right inside Excel. While Windows users get the built-in Analysis ToolPak, Mac users can install XLMiner Analysis ToolPak (a free add-in from Frontline Systems) for similar functionality.
- Generates descriptive statistics (mean, median, variance) easily
- Builds regression models for prediction
- Creates histograms, t-tests, ANOVA, and correlation analyses
- Provides random number generation for simulations
- Performs these operations without requiring any other software
Steps to Enable:
- Go to the File tab >> select Options.

- In the Excel Options dialog box:
- Select Add-ins >> select Excel Add-ins >> click Go.

- Select Analysis ToolPak >> click OK.

Steps to Use:
- Go to the Data tab >> from Analyze >> select Data Analysis.
- Select the analysis type from the available options.
- Click OK.

On Mac:
- Download XLMiner Analysis ToolPak from Microsoft AppSource, then find it under the Add-ins tab.
3. Solver Add-in
The Solver add-in is a constrained optimization engine (linear and nonlinear). Solver goes beyond regular formulas by finding the optimal solution to complex problems. It’s perfect for enthusiasts who like to explore “what’s the best outcome?” questions.
- Optimizes a target cell (maximize, minimize, or reach a specific value) to get the best solution
- Adjusts multiple decision variables automatically
- Handles constraints (e.g., budget limits, capacity restrictions)
- Solves linear, nonlinear, and integer optimization problems
Example: Allocate a monthly budget across hobbies (travel, books, courses) to maximize learning without exceeding your spending limit. Design a schedule that fits the most activities within limited hours.
Steps to Enable:
- Go to the File tab >> select Options >> select Add-ins >> select Excel Add-ins >> click Go.
- Select Solver Add-in >> click OK.

Steps to Use:
- Go to the Data tab >> from Analyze >> select Solver.

4. Power Pivot (Data Model & DAX)
Power Pivot is Excel’s built-in data model with DAX (Data Analysis Expressions) formulas and relationships for large or relational datasets.
- Imports and handles millions of rows without slowing down
- Creates relationships between multiple tables (like a relational database)
- Uses DAX formulas for advanced calculations
- Builds PivotTables and PivotCharts from linked datasets
Example: Link your “Sales Data,” “Customer Info,” and “Product Details” tables to build an interactive dashboard that lets you slice and dice results creatively.
Steps to Enable:
- Go to the File tab >> select Options >> select Add-ins >> select COM Add-ins >> click Go.

- Select Microsoft Power Pivot for Excel >> click OK.

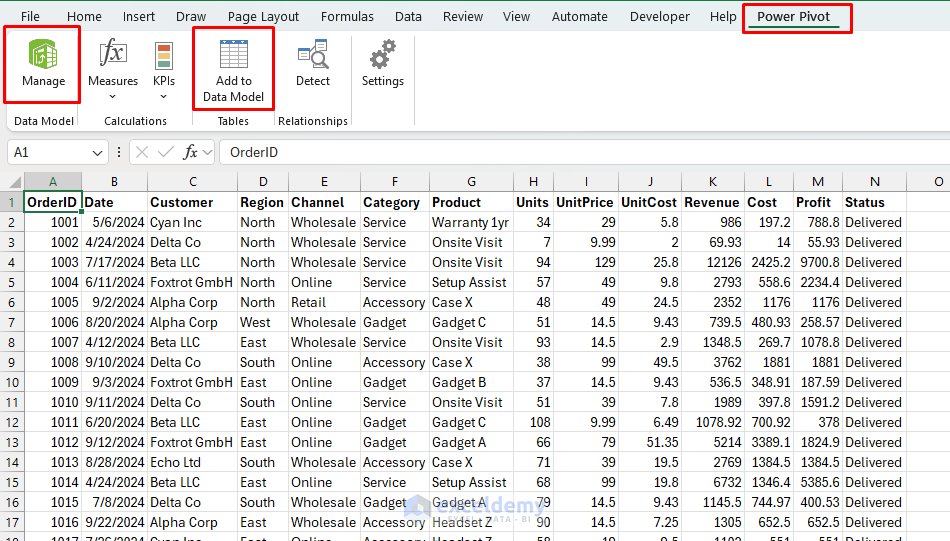
Steps to Use:
- It appears as a new tab named Power Pivot.
- Go to the Power Pivot tab >> select Manage or Add to Data Model.
5. Inquire Add-in
Debugging creative workbooks can be a challenge. The Inquire add-in helps you audit, compare, and map out formulas.
- If you’ve built an interactive art project or financial dashboard, Inquire shows where formulas link together
- Makes complex workbooks easier to maintain
- Compares two workbooks side by side to highlight differences
- Creates a workbook relationship diagram to map links between sheets
- Identifies errors, broken links, or hidden cells
- Offers a “Clean Excess Formatting” option to slim down file size
Example: If you’re designing a financial dashboard with multiple sheets, Inquire ensures no hidden errors undermine your model.
Steps to Enable:
- Go to the File tab >> select Options >> select Add-ins >> select COM Add-ins >> click Go.
- Select Inquire >> click OK.

Steps to Use:
- It appears as a new tab named Inquire.
- Go to the Inquire tab >> select Workbook Analysis.

6. Data Streamer Add-in
Data Streamer turns Excel into a real-time data monitor. You can stream data directly from sensors, IoT devices, or microcontrollers (like Arduino) into Excel and visualize it instantly.
- Streams live data from serial devices (e.g., Arduino, micro:bit, sensors)
- Logs and records real-time data in worksheets
- Allows two-way communication—you can also send commands back to the device
- Perfect for STEM experiments, IoT prototypes, and real-world data demos
Example:
- Connect a temperature sensor to Arduino → stream live readings into Excel → visualize with charts updating in real time
- Build a DIY heart rate monitor or motion detector and track outputs instantly
Steps to Enable:
- Go to the File tab >> select Options >> select Add-ins >> select COM Add-ins >> click Go.
- Select Microsoft Data Streamer for Excel >> click OK.

Steps to Use:
- Once enabled, a new Data Streamer tab appears on the ribbon.
- Connect your device to stream your data.

Availability: Included only with certain Microsoft 365 editions (Education, Enterprise, ProPlus), not Home/Student versions.
7. 3D Maps (Formerly Power Map)
3D Maps lets you explore and present data in three dimensions, making your analysis more immersive. It was known as Power Map in Excel 2013 and is now built in as 3D Maps in newer versions.
- Plots geographic and temporal data on a 3D globe or map
- Animates data over time to show changes and trends dynamically
- Builds tours and video exports for presentations
- Great for combining geography with storytelling
Example:
- Animate how your sales spread across different cities month by month
- Show travel routes or photography locations on a spinning 3D globe
Steps to Enable/Find It:
- In Excel 2016 and later: It’s already installed, but the button may not show on your ribbon.
- Go to the File tab >> select Options >> select Customize Ribbon.
- From the left list, choose All Commands.
- Look for 3D Map (not “Power Map”).
- Create a new custom group under the Insert tab (or any tab you prefer).
- Add the 3D Map command, click OK, and it will appear on your ribbon.

- In Excel 2013: Download and install the Power Map Preview add-in from Microsoft, then access it from Insert >> Map.
Steps to Use:
- Go to the Insert tab >> select 3D Maps.
- Launch 3D Maps based on your data.

Third-Party Add-ins Worth Exploring
While Microsoft’s official add-ins cover most creative needs, some third-party options can take your Excel experience even further:
- ASAP Utilities: 300+ productivity tools for cleaning, reshaping, and formatting data.
- XLTools: Version control, formula editor, date picker, and ready-made templates.
- Kutools for Excel: Powerful all-in-one toolkit with over 200 extra features.
Steps to Enable:
- Go to the Home tab >> select Add-ins.
- Search for add-ins and install from the store.

These are not built into Excel, but they can save hours of work if you’re a power user.
Wrapping Up
Excel is so much more than a basic spreadsheet program — it’s a creative platform for exploring, analyzing, and visualizing data. By unlocking add-ins like Power Query, Inquire, Analysis ToolPak, Power Pivot, Solver, and 3D Maps, you can transform the way you work with numbers. Whether you’re cleaning messy datasets, running advanced statistical models, or turning figures into eye-catching visuals, these tools let you approach data with curiosity and creativity.
With these tools, Excel becomes more than spreadsheets — it becomes your creative data studio.
Get FREE Advanced Excel Exercises with Solutions!
