Method 1 - Insert Table to Create Dynamic Chart with Multiple Series Steps: Select the complete dataset. Go to the Insert tab and select ...
When you are working with a dataset that needs to plot on a chart, you will try to create dynamic Excel charts with a drop-down list. A dynamic chart ...
The following dataset will be used to create dynamic charts in Excel using data filters. Method 1 - Filtering the Dataset to Create ...
You may have created Chart in Excel on the basis of some gathered data. But sometimes you may need to create a chart with a dynamic date range to ...
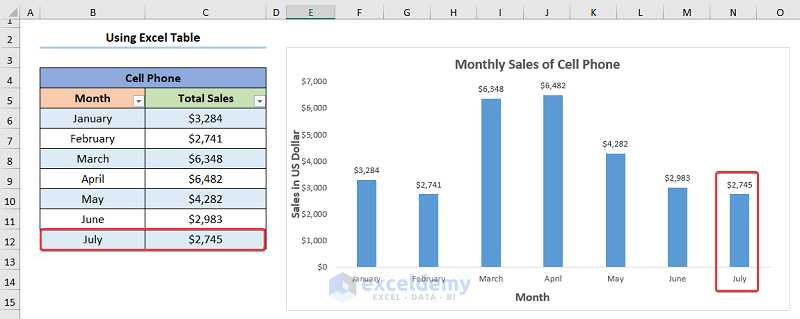
The dataset shows Month, and Total Sales in USD. Method 1 - Creating Dynamic Charts Using an Excel Table Steps: Select any ...
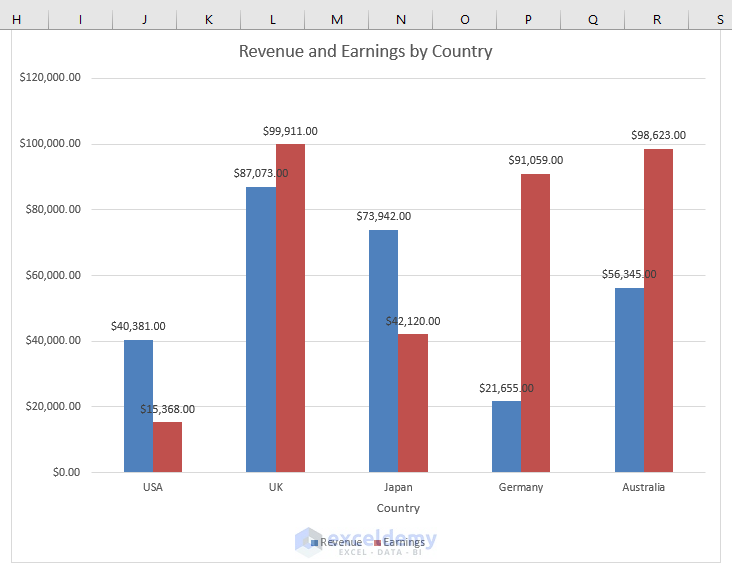
Dataset Overview We have a worksheet called Dataset that contains a table with the Country, Revenue, and Earnings of a company. Our objective ...
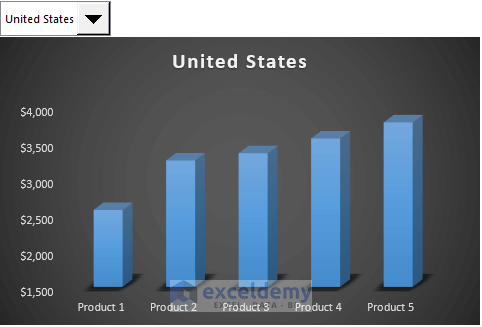
Method 1 - Using the INDEX Function In this method, we’ll create a dynamic chart in Excel that allows us to preview product sales amounts for ...
Method 1 - Use an Excel Table to Create a Dynamic Chart Range in Excel Select the whole dataset. Press Ctrl + T keys. A dialog box ...
Advanced Excel Exercises with Solutions PDF