Comparison Chart in Excel
Jul 15, 2024
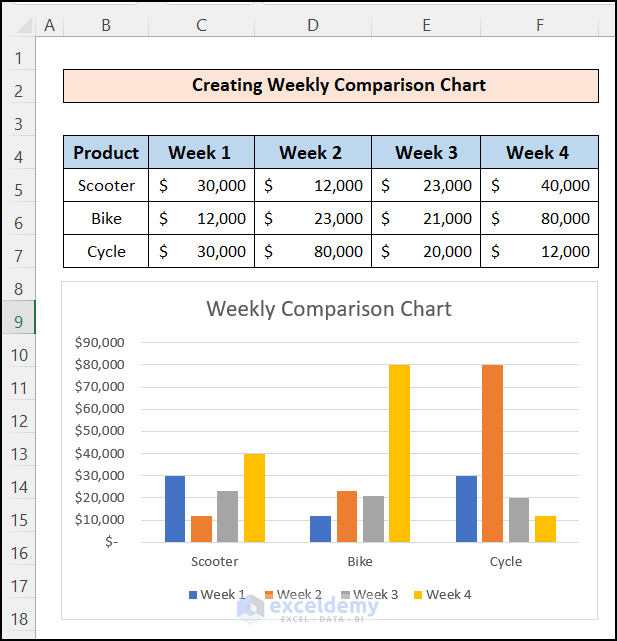
Step 1 - Create a Dataset
Create a dataset to create a weekly comparison chart in Excel. We have created a dataset with sales data for 3 ...
May 30, 2024
Method 1 - Use Pie Chart for One Set of Quarterly Data Comparison
Steps:
Select the range B4:C8.
Go to the Insert
Choose a pie- chart.
...
Jul 5, 2024
Example 1 - Year-over-Year Comparison with a Bar Chart
We have the data for goals scored by famous footballers in the 2016/17 and 2015/16 seasons. ...
Aug 14, 2024
This is the sample dataset.
Example 1 - Using a Clustered Column Chart
Steps:
Select B4:E13.
Go to the Insert tab ➤ Insert Column ...
Aug 9, 2024
Budget vs Actual Chart
A budget vs actual chart is used to determine the difference or variance between the forecast and actual value.
The ...
Aug 10, 2024
Method 1 - Using the INDEX Function to Create a Sales Comparison Chart in Excel
The following dataset showcases Monthly Sales of a Company.
To ...
Aug 2, 2024
The sample dataset showcases Name of Company, Branch Location, Sales, and Cost.
Example 1 - Using a 2-D Column Chart ...
Aug 7, 2024
Step 1 - Create an Organized Dataset
Steps:
Create a dataset based on month-to-month data. Here, monthly cost in production and ...
Nov 11, 2025
This article demonstrates how to make a side-by-side Comparison Chart in Excel. A Comparison Chart is a handy tool in a variety of situations. In ...
May 6, 2024
A salary comparison chart compares employee salaries across the various departments in an organization. Salaries are compared against survey data or ...
Jun 15, 2024
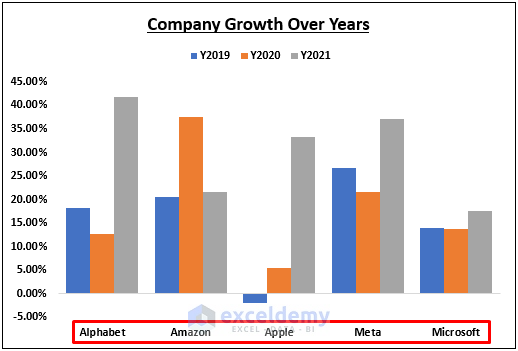
Consider the following dataset. It contains the annual growth of five U.S.-based companies. The letter Y before the years is used so that Excel ...
Aug 3, 2024
How to Make a Price Comparison Chart in Excel: 3 Examples
This is the sample dataset, containing product prices for different months and ...