
Power BI is a powerful tool to create interactive dashboards and reports. Excel has its familiarity and popularity, but sometimes you may need the flexibility of Excel’s PivotTables for deep, ad-hoc analysis. You can connect Excel directly to a Power BI semantic model (dataset) and build PivotTables, PivotCharts, and governed data that refresh in place. You can enjoy the best of both worlds.
In this tutorial, we show how to connect Excel to your Power BI datasets—where Power BI meets PivotTables.
Why Connect Excel to Power BI?
By connecting Excel to Power BI datasets, you can:
- Use live, refreshable Power BI data in Excel without exporting or duplicating. Works in Excel Desktop and Excel for the web
- Build custom PivotTables and PivotCharts quickly
- Share analysis without giving direct access to the Power BI workspace
- Combine Power BI data with other local Excel data for extended analysis
Prerequisites
Before you begin, ensure that you have the following items set up.
- A Power BI account is required to connect Excel to datasets in the service
- Publish the Power BI dataset to the Power BI Service
- Excel 2016 or later (or Microsoft 365) is required to access the built-in “From Power BI” feature
- Use the same account for both Excel and Power BI
Step 1: Publish Your Dataset to the Power BI Service
If your dataset isn’t yet in the Power BI Service:
- Open your Power BI Desktop file (.pbix)
- Go to the Home tab >> select Publish >> select My workspace or a specific workspace
- Choose Select and click OK

- Wait until you see the confirmation message: Success!

Step 2: Connect Excel to Power BI Datasets
There are two ways to connect Excel to Power BI datasets.
Method 1: Directly Connect Excel to Power BI
- Launch Excel
- Go to the Data tab >> select Get Data → From Fabric & Power BI Platform >> select Power BI
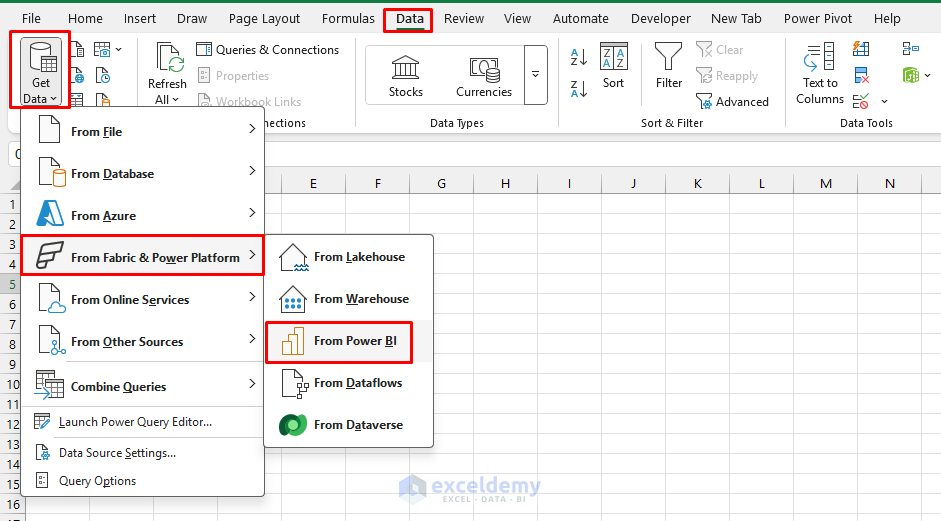
- Or go to the Insert tab >> select PivotTable >> select From Power BI

- The Power BI Datasets pane opens
- You’ll see a list of available datasets from your workspace
- Select your dataset and click Insert PivotTable or Insert Table

- Your connected PivotTable is ready to use

Excel creates a live connection to the Power BI semantic model. Every field you drag and every refresh run against that model.
Method 2: Use “Analyze in Excel” in the Power BI Service
- Open the Power BI Service app
- Go to My workspace and find your semantic model (or a report built on it)
- Click the three dots (…) >> select Analyze in Excel
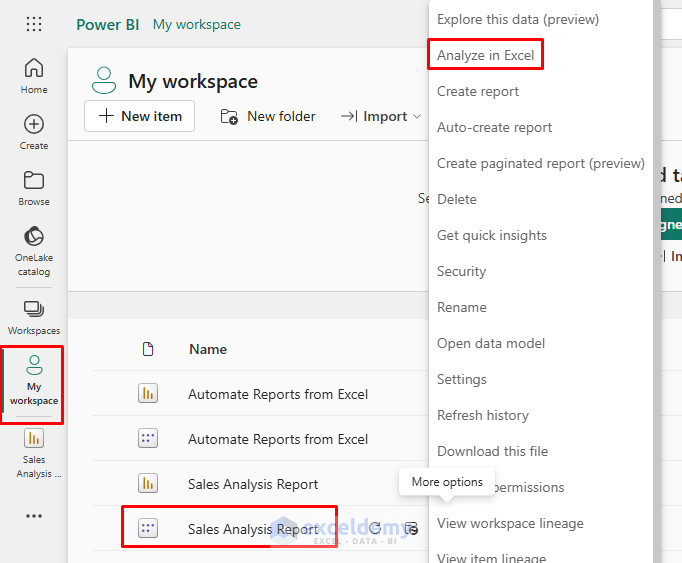
- Power BI creates an Excel workbook that’s already connected to that model
- It will be saved to OneDrive/SharePoint or downloaded to your PC

- Open it in Excel or Excel for the web and start pivoting
Tip: In newer versions, you may also see Export to Excel with live connection in the service (up to 500k rows to a refreshable table), which is useful when you need a connected table instead of a pivot. Microsoft Learn: Analyze in Excel
Step 3: Explore the Dataset with PivotTables
Once you insert the PivotTable or table, you can explore and perform other calculations using the dataset.
- Excel automatically inserts a blank PivotTable linked to your dataset
- In the PivotTable Fields pane:
- Drag fields into Rows, Columns, Values, and Filters
- Use measures and calculated columns from Power BI directly
- Format your PivotTable as you like, applying styles and number formatting
Sales and Profit by Category:
- Drag Category to the Rows area
- Drag SalesAmount to the Values area
- Drag Profit to the Values area

Step 4: Build PivotCharts for Visual Insights
Create a PivotChart:
- Select your PivotTable
- Go to the PivotTable Analyze tab >> select PivotChart
- Choose the chart type Clustered Column
- Click OK
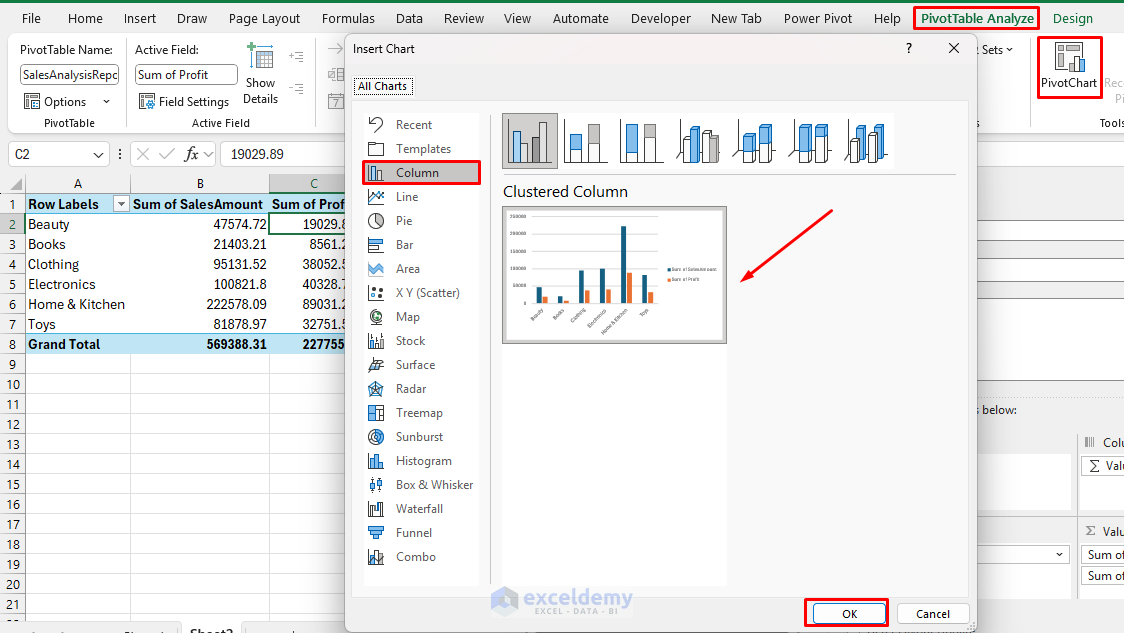
- A clustered column chart appears, showing sales and profit by category

- You can also create a Pie chart to show sales percentage
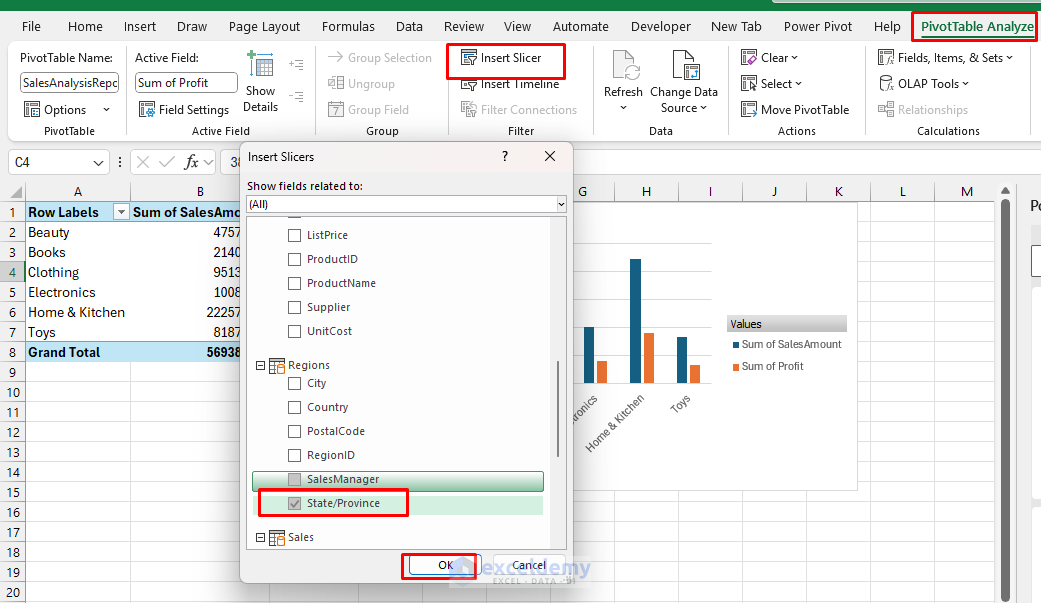
Insert Slicers:
- Use Slicers for interactive filtering:
- Go to the PivotTable Analyze tab >> select Insert Slicer and pick the fields to filter
- Style and align slicers for a dashboard-like experience
Insert a Timeline:
- Go to the PivotTable Analyze tab >> select Insert Timeline and pick the date fields to filter

Test the Report:
- Organize the charts and slicers to give a report look

- Select a state from the slicer and a year from the timeline
- The report updates automatically

- You can use the Quick Explore icon in Excel that appears in PivotTables connected to a data model such as a Power BI dataset
- If your selected cell has related data or lower hierarchy levels to drill into, it provides a quick way to navigate to detailed or related fields without manually rearranging the PivotTable

Step 5: Refresh and Share Your Data
Save: Save the workbook in OneDrive/SharePoint and share it with colleagues who also have access to the underlying model.
- Go to the File tab >> select Save As >> select OneDrive/SharePoint

Refresh Data: Refresh in Excel pulls the latest data from the published model (which itself refreshes on its schedule in Power BI).
- Because this connection is live, you don’t need to re-import data
- Go to the Data tab >> select Refresh All
- Excel queries the Power BI Service and returns the latest results

Security:
- RLS is enforced:
- Users only see what their role allows when they open or refresh
- This applies to Analyze in Excel and to connected pivots/tables; viewers with Build permission remain limited by RLS
Step 6: Combine Power BI Data with Local Excel Data (Optional)
You can enhance your analysis by combining live Power BI data with local Excel data:
- Create a second PivotTable from your local table
- Use Power Query to merge the datasets
- Build combined PivotTables or charts
Tips for a Smooth Experience
- Stay signed in; if you switch accounts, the connection may break
- Use measures from Power BI; they’re optimized for performance
- Limit unnecessary fields to keep PivotTables fast and responsive
- Mind permissions—users need access to the dataset in Power BI to view PivotTable results
Conclusion
Connecting Excel to your Power BI datasets creates a live link between two powerful tools. It gives analysts the best of both platforms. You can keep using familiar PivotTables while utilizing centralized, secure Power BI data—no more messy exports or outdated copies. Whether you’re preparing quick one-off reports or building a recurring analysis file, this integration can save time and keep your insights consistent.
Get FREE Advanced Excel Exercises with Solutions!
