
Image by Editor
Power BI is a powerful tool for data analysis and visualization. One of the key aspects of Power BI is the ability to build efficient data models that allow you to analyze data from different sources in an insightful way.
In this tutorial, we will cover the essentials of building relationships and mastering DAX (Data Analysis Expressions) to build a robust data model.
Understanding Data Modeling in Power BI
Data modeling is the process of structuring your data sources in a way that allows you to create meaningful relationships between different datasets. A well-designed model ensures that users can work with data efficiently, minimizing redundancies and enabling faster reporting and analysis.
A Power BI data model typically consists of tables, columns, and relationships. You’ll start by importing your data and ensuring it’s well-organized before establishing relationships between tables.
Star Schema vs. Snowflake Schema
- Star Schema: Organizes data into fact tables and dimension tables. This is the preferred structure for simplicity and performance.
- Snowflake Schema: A more normalized version of the star schema, where dimension tables are further split into sub-dimensions.
Tip: Aim for a Star Schema whenever possible for better performance and simpler DAX.
Building Relationships in Power BI
A relationship connects data between two tables, allowing Power BI to combine the data from multiple sources. Relationships are used to connect different tables so that you can create meaningful visualizations.
Types of Relationships:
- One-to-One (1:1): Each row in Table A is related to one row in Table B.
- One-to-Many (1:*): One row in Table A corresponds to many rows in Table B. This is the most common relationship type.
- Many-to-One (*:1): The inverse of one-to-many.
- Many-to-Many (:): Multiple rows in Table A relate to multiple rows in Table B. This type of relationship is less common and requires careful handling.
Build Relationships
- Load your data into Power BI. You can load data from any source.
- We loaded data from an Excel workbook.

- Click on the Model view icon from the left side panel to switch to Model view.
- Power BI automatically detects the relationship type and builds relationships.
- Or select a field from one table (e.g., a primary key), and drag it to the corresponding field at another table (e.g., foreign key).

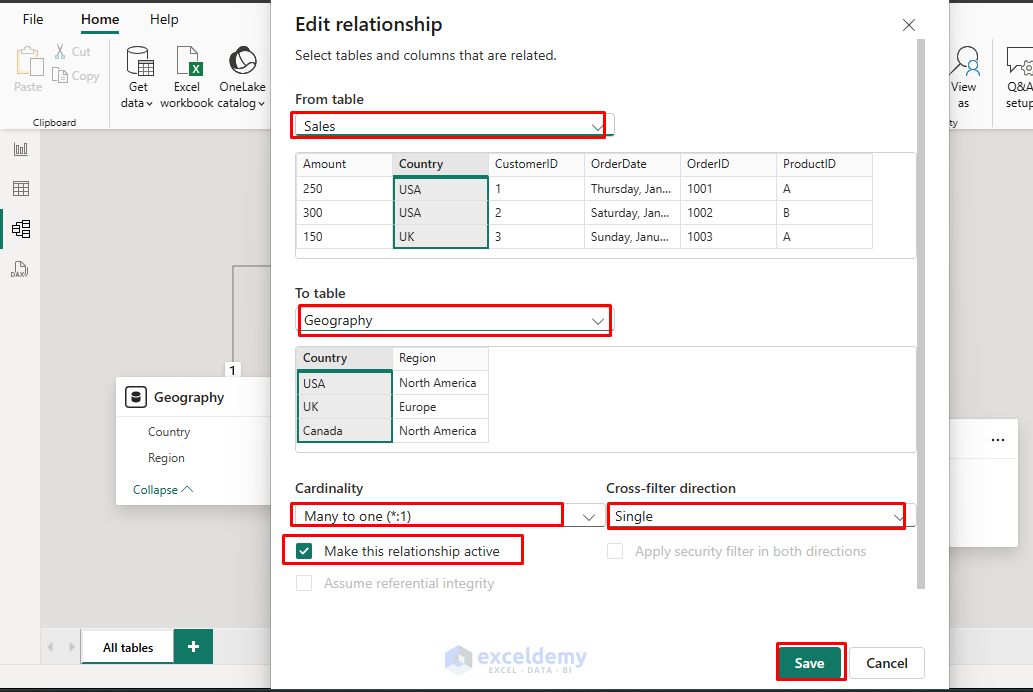
- You can edit a relationship by clicking on the relationship and modifying its properties.
- Right-click on the Relationship >> select Properties.

- In the Edit relationship box;
- Select Cardinality (1:1, 1:*, *:1, or :).
- Select Cross-filter direction (Single or Both).
- Check the Active or inactive status.
- Click Save.
Cross-filter Direction
- Single: Filtering the “one” side affects the “many” sides.
- Both: Filtering either side affects the other (use sparingly for performance reasons).
Active vs. Inactive Relationships
- Each table can have only one active relationship path to another table.
- Inactive relationships require the USERELATIONSHIP function in DAX to activate them.
Manage Relationships:
- Go to the Home tab >> select Manage relationships.
- The Manage Relationship dialog box;
- Create New relationships.
- Edit relationships.
- Delete relationships.
- Filter relationships.

Mastering DAX (Data Analysis Expressions)
DAX is the formula language used in Power BI for creating custom calculations, such as measures and calculated columns, and tables. It’s similar to Excel formulas but optimized for use in Power BI’s data models.
Context in DAX:
- Row Context: When DAX calculates row-by-row (for example, in calculated columns), it operates in row context. This allows DAX to access data for the current row.
- Filter Context: When DAX is used in a visual or measure, it is evaluated in a filter context. This means that the calculation depends on the filters applied to the report.
Common Functions:
- Aggregation: SUM, COUNT, MIN, MAX, AVERAGE.
- Time intelligence: SAMEPERIODLASTYEAR, PREVIOUSMONTH, DATESYTD.
- Filter manipulation: CALCULATE, FILTER, ALL, ALLEXCEPT.
- Text operations: CONCATENATE, FORMAT, LEFT, RIGHT.
- Logical operations: IF, AND, OR, SWITCH.
Create DAX Calculated Columns
These are columns added to your table, calculated row-by-row. They are typically used for transformations like creating categories or calculating new values.
- Added to tables and calculated row by row.
- Use when you need a value for each row.
- Impact performance by increasing model size.
Let’s create a new Profit column for the Sales table:
- Click on the Table view icon from the left side panel to switch to Table view.
- Select the Sales table.
- Select New column from Calculations.

- Insert the following DAX formula.
Profit = Sales[Amount] - Sales[Cost]
- Click on the Tick (✓) mark.
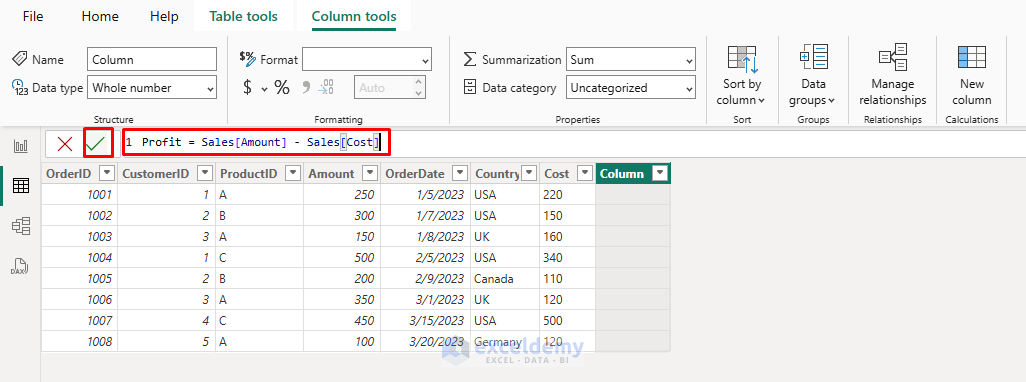
The new Profit column shows profit per row.
Create DAX Measures
These are dynamic calculations that aggregate values based on the context (e.g., sums, averages). Measures are typically used for creating KPIs, totals, and other calculations that vary with the report filters.
- Calculated on the fly when used in visualizations.
- Better for aggregations and dynamic calculations.
- More efficient for performance.
Let’s create a Measure to calculate Total Sales:
- Click on the Table view icon from the left side panel to switch to Table view.
- Select the Sales table.
- Select New measure from Calculations.
- Insert the following DAX formula.
Total Sales = SUM(Sales[Amount])
- Click on the Tick (✓) mark.
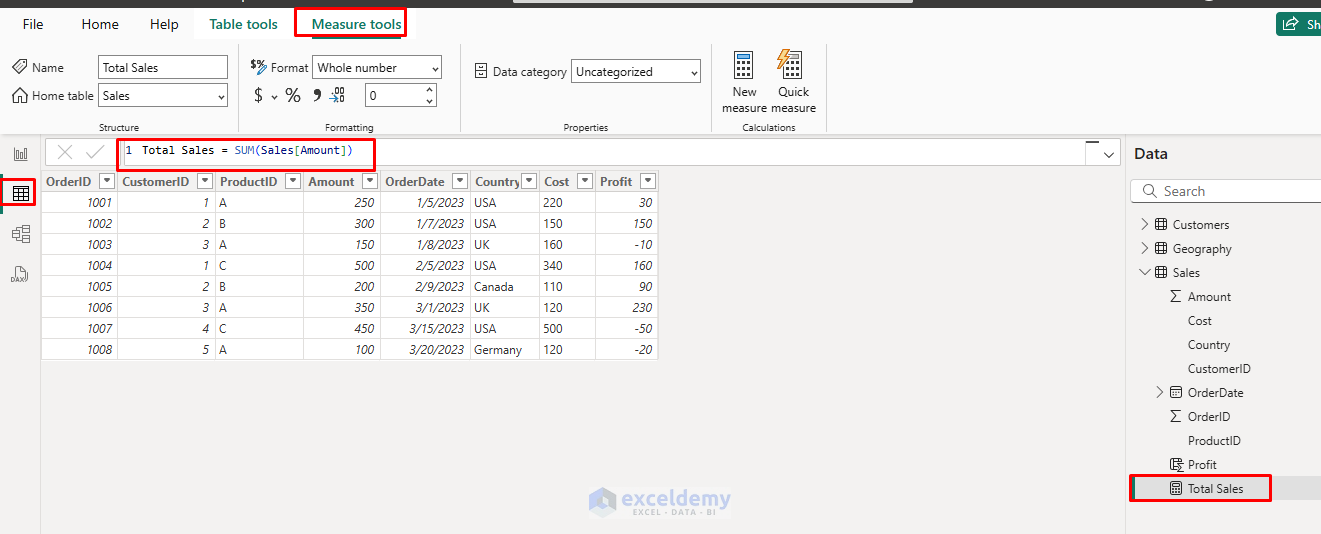
It creates a reusable measure that you can drag into visuals (e.g., cards, tables, charts). It won’t be visible on the table but listed in the Sales dataset.
Create Calculated Tables
These are tables that are derived from existing data using DAX formulas. They allow you to create new tables for analysis.
Let’s create a Calculated Table:
- Click on the Table view icon from the left side panel to switch to Table view.
- Select New table from Calculations.
- Insert the following DAX formula.
HighValueOrders = FILTER(Sales, Sales[Amount] > 300)
- Click on the Tick (✓) mark.

This formula creates a new table HighValueOrders, that contains only orders with a sales Amount greater than 300.

Advanced DAX Techniques
1. CALCULATE Function: The Most Powerful Function in DAX
The CALCULATE function is one of the most powerful and frequently used functions in DAX. It allows you to change the filter context for a calculation, enabling complex filtering logic and dynamic aggregations.
Syntax:
CALCULATE(<expression>, <filter1>, <filter2>, ...)
This function evaluates an expression (like a sum or average) in a modified filter context. You can apply multiple filters to modify the data being evaluated.
Let’s calculate the total sales for a specific region:
- Select New measure from Calculations.
- Insert the following DAX formula.
Sales in USA = CALCULATE(
    SUM(Sales[Amount]),
    Sales[Country] = "USA"
)

This measure calculates the total sales in the USA by applying a filter on the Geography[Country] column to only consider rows where the country is “USA”.
2. Variables in DAX: Improves Readability and Performance
In DAX, variables are used to store intermediate results for use in a calculation. Using variables improves both the readability of the formula and its performance by reducing redundant calculations.
Syntax:
VAR <variable_name> = <expression>
RETURN <expression_using_variable>
Variables can calculate the profit margin, which is the difference between total sales and total cost, divided by total sales. You can use variables to store intermediate results.
Let’s calculate the Profit Margin using variables:
- Select New measure from Calculations.
- Insert the following DAX formula.
Profit Margin =
VAR TotalSales = SUM(Sales[Amount])
VAR TotalCost = SUM(Sales[Cost])
RETURN
    DIVIDE(TotalSales - TotalCost, TotalSales)

Here, TotalSales and TotalCost are calculated first and stored as variables, making the formula more readable and improving performance by avoiding recalculating the same values.
3. Time Intelligence: Time-Based Calculations
DAX includes built-in time intelligence functions that allow you to perform calculations over time, such as calculating Year-to-Date (YTD), Month-to-Date (MTD), or comparing values across different periods.
YTD Calculation: Calculate the total revenue for the year up until the current month.
- Select New measure from Calculations.
- Insert the following DAX formula.
Sales YTD = TOTALYTD(
    SUM(Sales[Amount]),
    Sales[OrderDate]
)
- TOTALYTD() calculates the running total (cumulative sum) of sales Amount from the start of the year up to the current row’s date.
- Sales[OrderDate] is the column used to determine the date context.

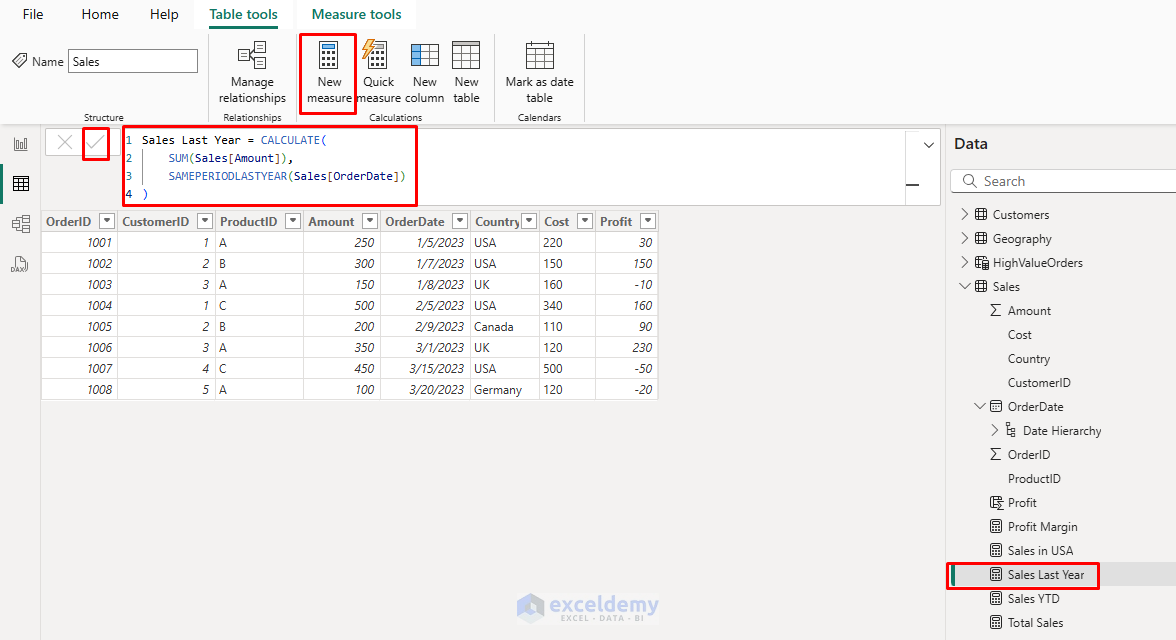
Same Period Last Year (SPLY): Compare the sales this year with sales from the same period last year:
- Select New measure from Calculations.
- Insert the following DAX formula.
Sales Last Year = CALCULATE(
    SUM(Sales[Amount]),
    SAMEPERIODLASTYEAR(Sales[OrderDate])
)
- SAMEPERIODLASTYEAR() shifts the current date context back by exactly one year.
- CALCULATE() changes the context of the sum to that of last year.
Best Practices of Data Model and DAX
Data Model Optimization:
- Avoid many-to-many relationships when possible.
- Remove unnecessary columns.
- Use integer keys for relationships.
- Keep the date tables separate and properly formatted.
DAX Efficiency
- Use variables to avoid recalculating expressions.
- Avoid complex calculated columns when measures will work.
- Use appropriate filter functions (ALL, FILTER, etc.).
- Test performance with larger datasets.
Conclusion
Mastering data modeling and DAX in Power BI is essential for building efficient, scalable, and insightful reports. By following our article guidelines, you can build relationships, create dynamic measures, and leverage DAX functions. Start with simple models and gradually incorporate more complex techniques as you become comfortable with the basics. Remember that a well-designed data model makes everything else in Power BI easier, from writing calculations to building reports and dashboards that deliver valuable insights.
Get FREE Advanced Excel Exercises with Solutions!
