Method 1 – Find the Coefficient of Determination from the Correlation Coefficient
1.1 Using Arithmetic Formula
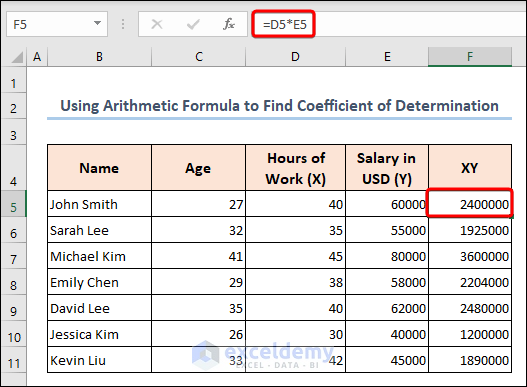
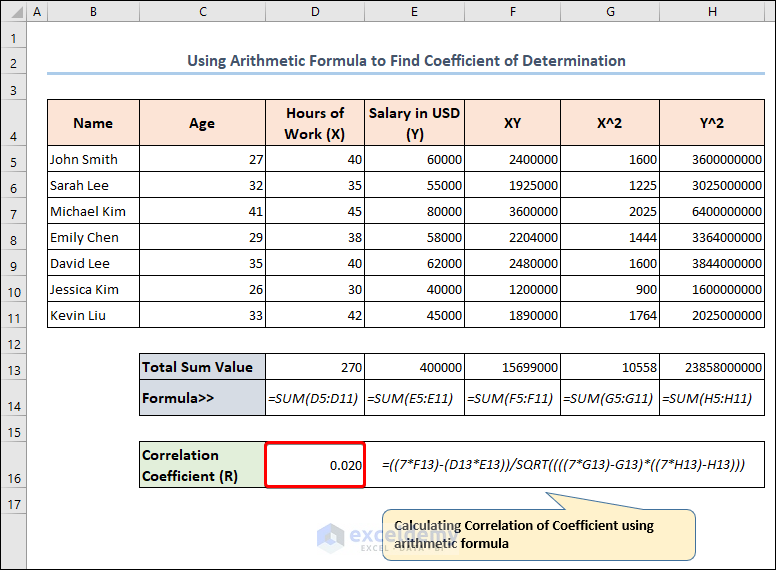
Steps 1:
- Multiply the independent and dependent variables in a new column.
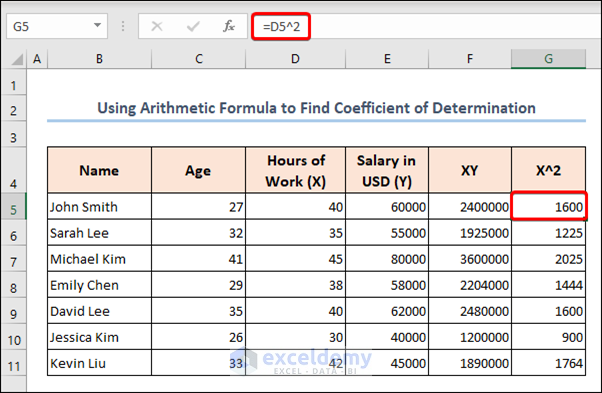
- Calculate the X^2 value in another column.
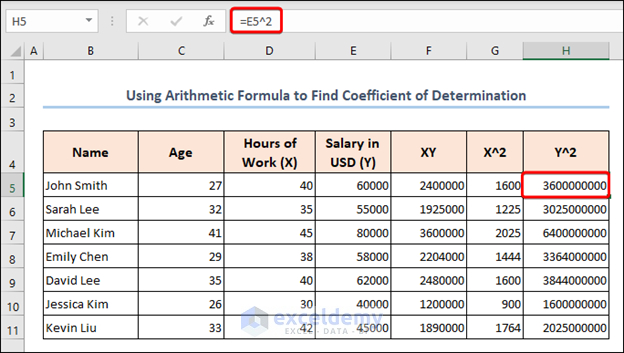
- Determine the Y^2 value for all the employees.
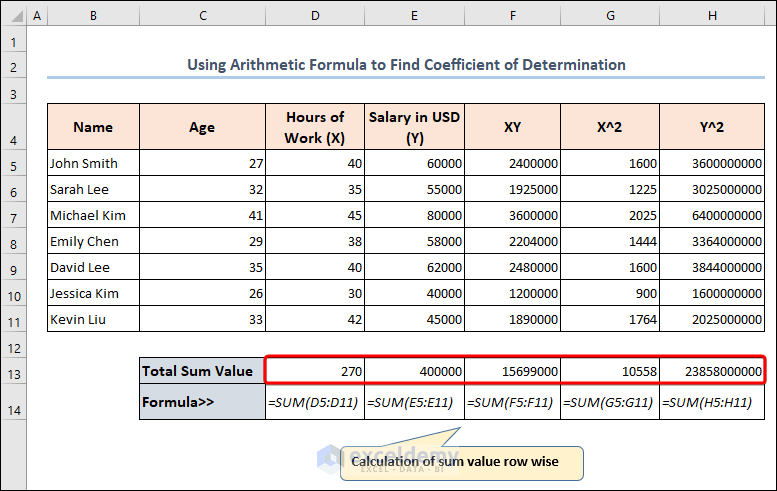
Steps 2:
- Using the SUM function we will compute the Total Sum Value for each row.
- Use our arithmetic formula to calculate Correlation Coefficient (R) –
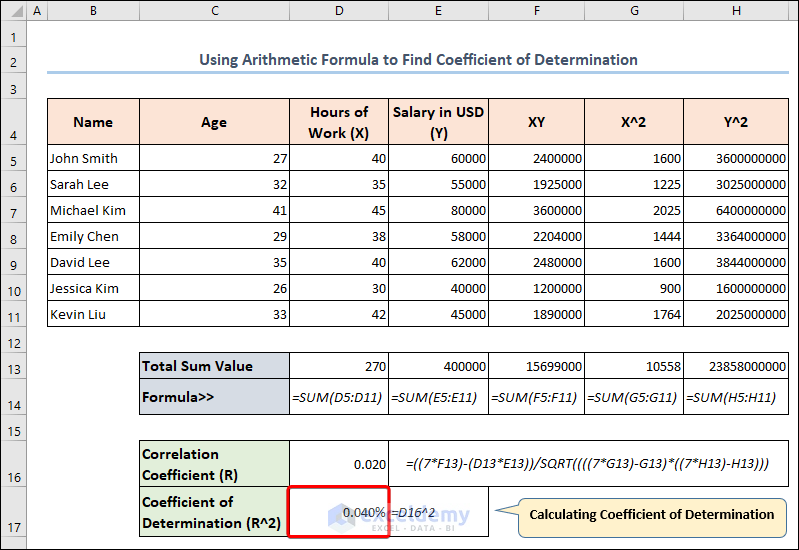
- We will square the value to get the Coefficient of Determination (R^2) with the below formula-
- We calculated the coefficient of determination in Excel.
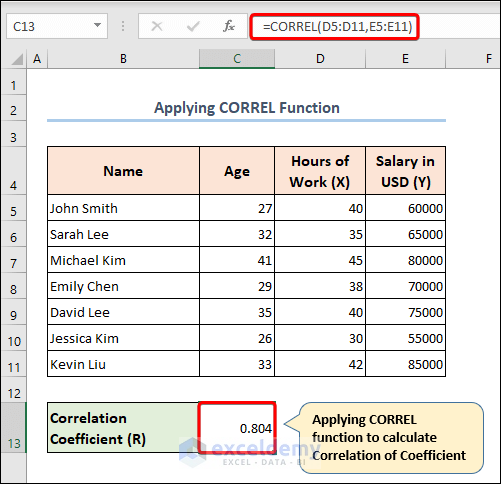
1.2 Applying CORREL Function.
Steps:
- Use the CORREL function using the data range for both X and Y.
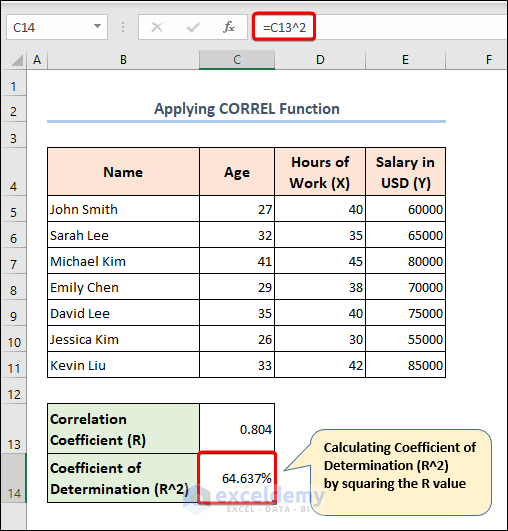
- We will square the R-value to get our coefficient of determination output.
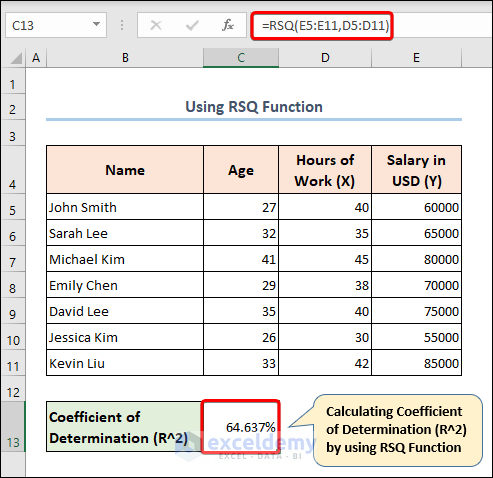
Method 2 – Using RSQ Function to Calculate Coefficient of Determination
Steps:
- Choosing a cell (C13), write the below formula to determine the coefficient of determination.
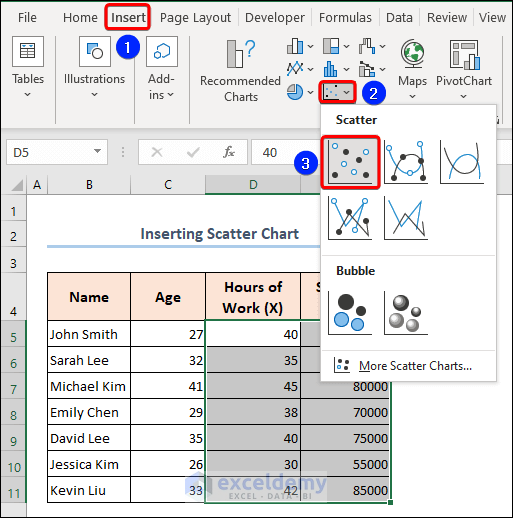
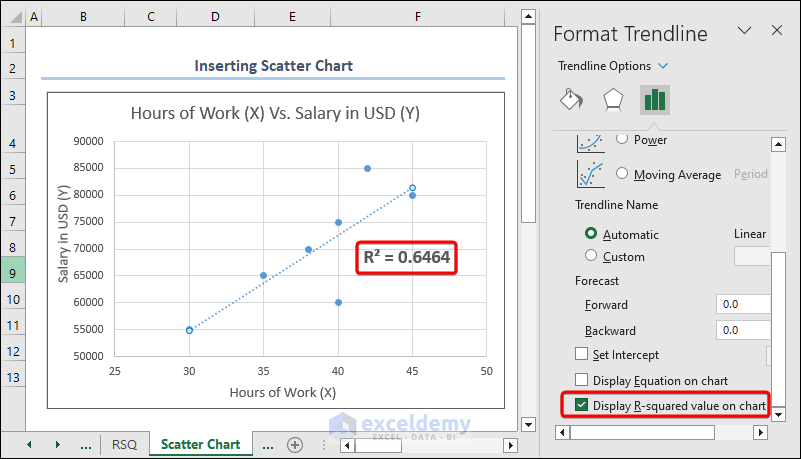
Method 3 – Inserting Scatter Chart to Find the Coefficient of Determination
Steps:
- Selecting the variables plot a scatter chart from the Insert option.
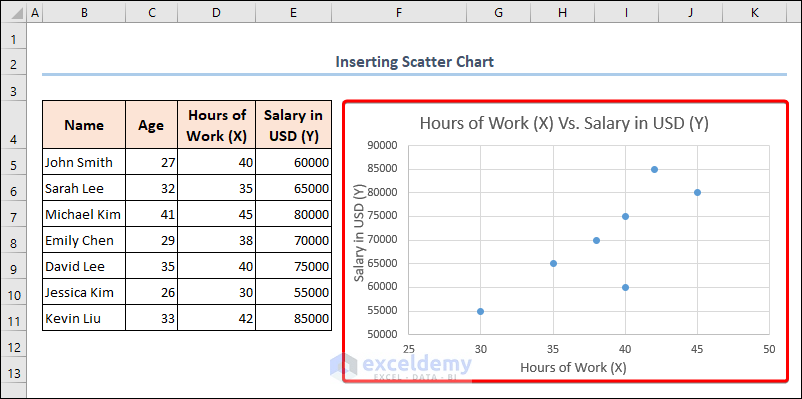
- Get a scatter chart inside the worksheet.
- Change the Axis Title and Chart Title from the chart.
- The data points open Advanced options and press the Add Trendline option to add a trendline between the values.
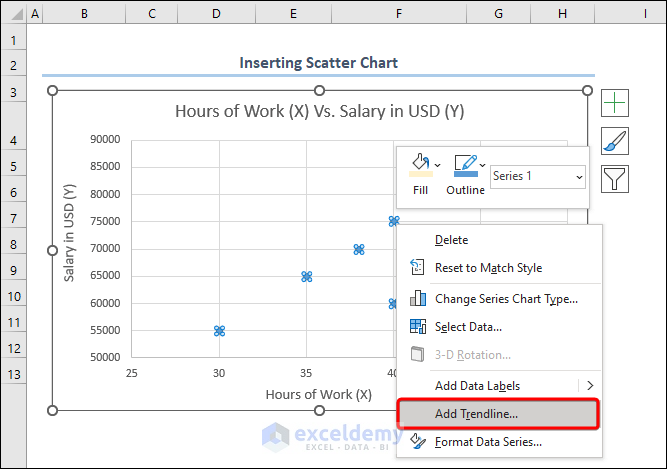
- Get the coefficient of determination (R^2), checkmark the Display R-squared value on chart option from the right pane.
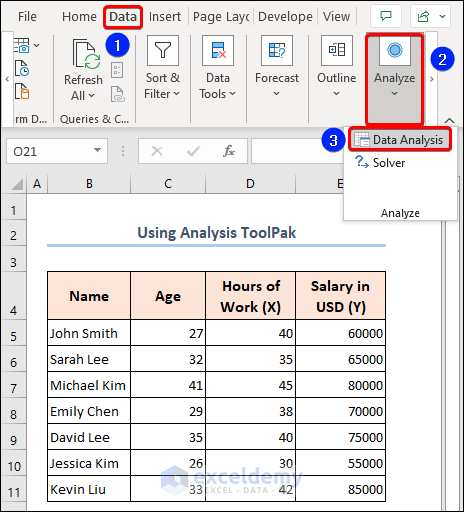
Method 4 – Using Analysis ToolPak
Steps:
- Click the Data Analysis option from the Data
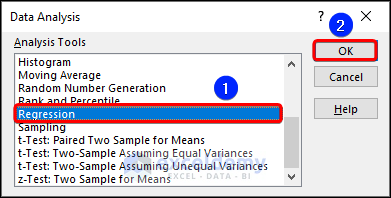
- From the Data Analysis window, choose Regression and hit OK.
- From the popped-up window named Regression choose your Input Y Range and Input X Range and click OK.
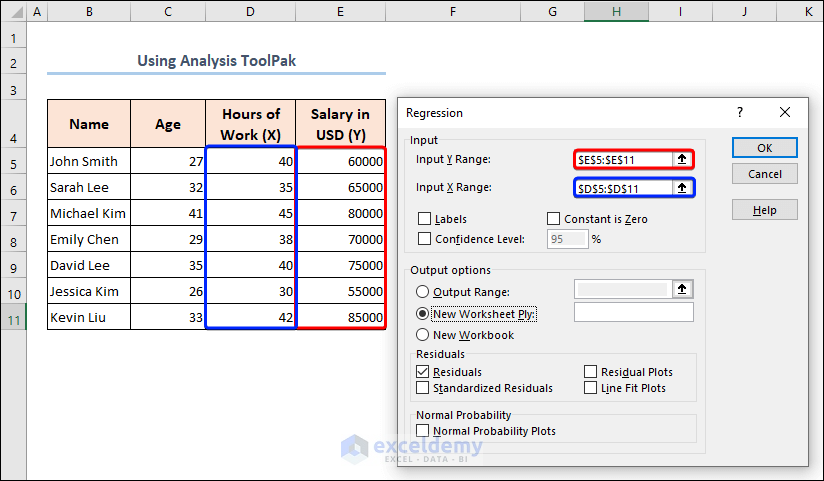
- A new worksheet will open, where you will get your coefficient of determination (R Square) value.
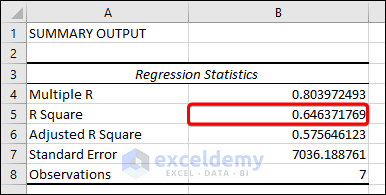
Interpretation of the Output of Coefficient of Determination:
Coefficient of Determination is a useful measure for evaluating the strength of a relationship between two variables. Still, it should be interpreted in conjunction with other statistical measures and with consideration of other factors that may be affecting the relationship.
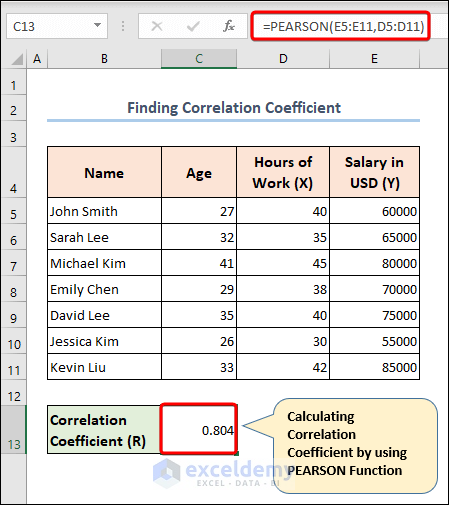
How to Find Correlation Coefficient in Excel
Steps:
- Apply the formula in a cell (C13) with the data ranges, including the independent and dependent variables, to get the correlation of coefficient (R) result.
Things to Remember
- When interpreting the Coefficient of Determination (R^2), it’s important to keep in mind that a high R-squared value does not necessarily indicate causation or a strong relationship between the two variables.
Frequently Asked Questions
1. What is the difference between the correlation coefficient and the coefficient of determination?
The main difference between the correlation coefficient and coefficient of determination is that the correlation coefficient is a measurement of the relationship between two variables and on the other hand, the coefficient of determination is a measurement of the proportion of the variance between variables. The correlation coefficient indicates the strength of the relationship between two variables, but it does not provide information about how much of the variation in one variable is explained by the other variable. The coefficient of determination, on the other hand, provides a more complete picture of the relationship.
2. What is a good R-squared value?
R-squared values depend on the chosen independent and dependent variables. According to the result of the R-squared value, there is no such thing as whether the final result is good or bad. But higher R-squared values indicate a better relationship between the variables.
3. Can I calculate the adjusted R-squared value in Excel?
Yes, you can calculate the adjusted R-squared value in Excel using a formula. The formula is:
Where,
R-squared= R-squared value
n= sample size
k= number of independent variables
The adjusted R-squared value handicaps for overfitting by adjusting the R-squared value based on the sample size and number of independent variables.
3. Can I find the coefficient of determination for multiple regression in Excel?
Yes, you can find the coefficient of determination for multiple regression using the RSQ function. The RSQ function returns the coefficient of determination between two cell ranges.
Download Practice Workbook
You can download our practice workbook from here for free!
Related Articles
- How to Show Relationship Between Two Variables in Excel Graph
- How to Calculate P Value for Spearman Correlation in Excel
- How to Find Spearman Rank Correlation Coefficient in Excel
- How to Calculate Intraclass Correlation Coefficient in Excel
- How to Find Correlation Coefficient in Excel Scatter Plot
<< Go Back to Correlation Coefficient in Excel | Excel Correlation | Excel for Statistics | Learn Excel
Get FREE Advanced Excel Exercises with Solutions!
