What Is the Intraclass Correlation Coefficient?
The Intraclass Correlation Coefficient (ICC) determines the reliability of ratings for multiple items. The ratings are measured by comparing the variability of different ratings of the same item (or subject) rated reliably by different users.
The ratings are quantitative. The value of an ICC can range from 0 to 1, where 0 means no reliability and 1 means perfect reliability among raters.
The calculation takes into account the following:
| Factors | Description |
|---|---|
| Model |
|
| Type of Relationship |
|
| Unit |
|
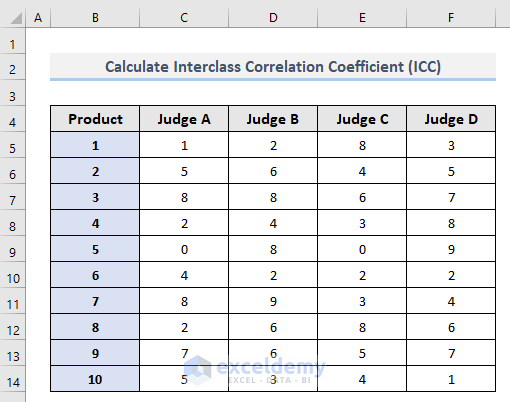
How to Calculate the Intraclass Correlation Coefficient (ICC) with Example
We have four different judges who rated the quality of 10 different products. The ratings are shown below.
Steps:
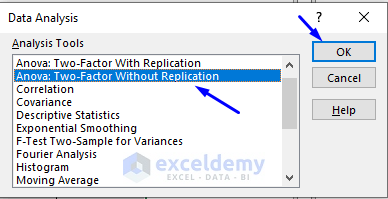
- Go to the Data tab and select Data Analysis.

- A Data Analysis pop-up window will appear. Select Anova: Two-Factor Without Replication.
- Click OK.
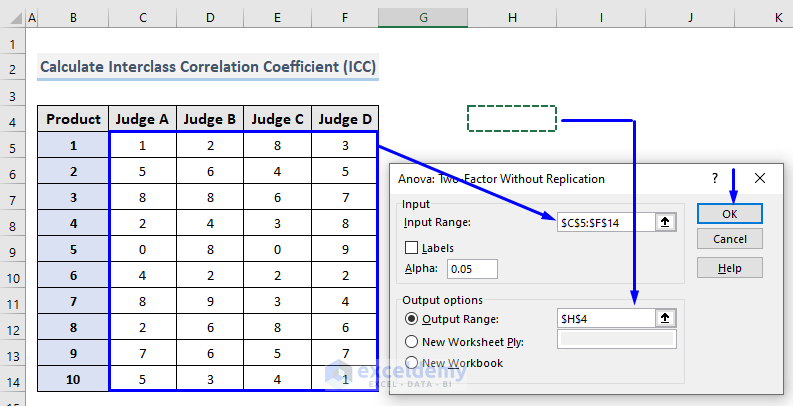
- The Anova: Two-Factor Without Replication pop-up window will appear. In the Input Range box, drag through the whole range from your dataset that contains the rating values. For our sample, the range is C5:F14.
- In the Output Range box, click on the cell in your dataset that you want as the starting cell of the output result. We selected cell H4.
- Click OK.
- You will get the outcome of the Anova: Two-Factor Without Replication in your worksheet.
- You will be able to see the whole Summary of the calculations along with the individual Count, Sum, Average, and Variance of the ratings by the Judges for the Products.
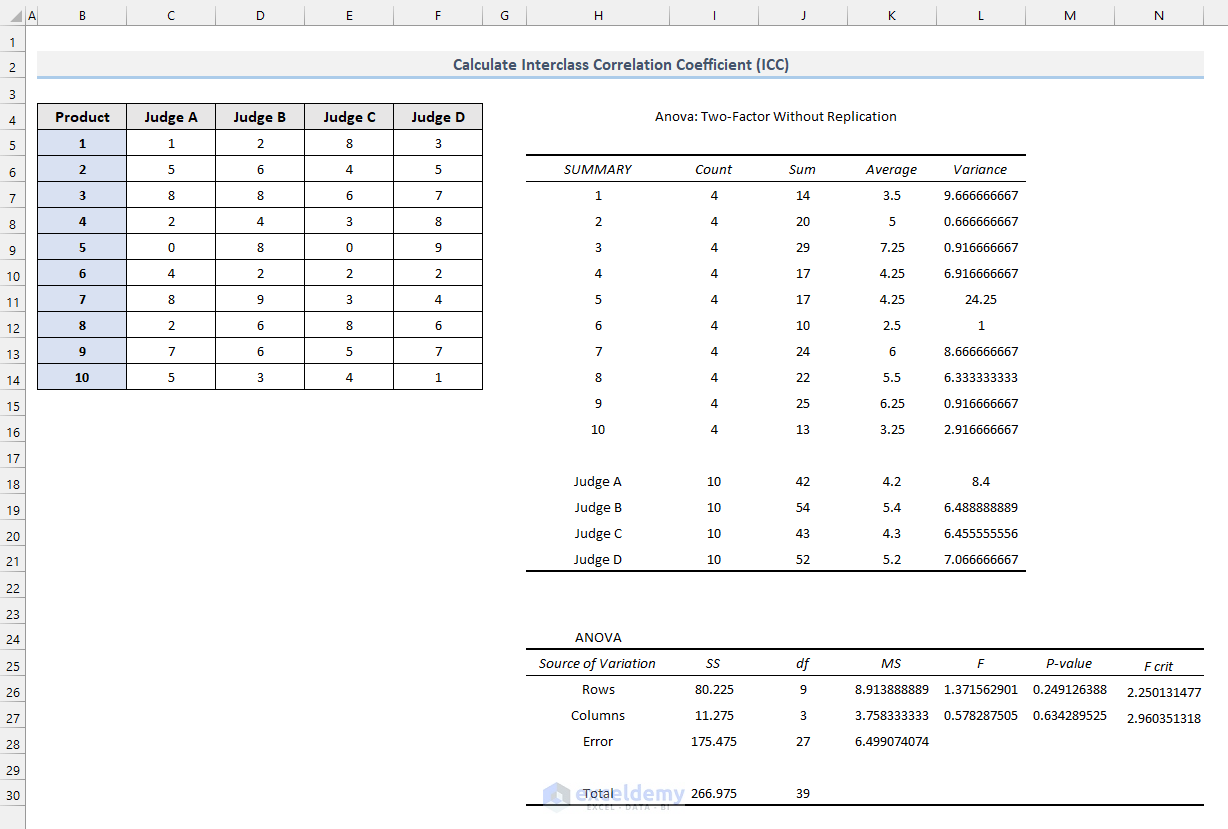
- To measure the ICC based on those rating variations, you need the bottom Anova table for input values.
- The formula to calculate the Intraclass Correlation Coefficient (ICC) for the extracted output is:
=(K26-K28)/(K26+J27*K28+(J27+1)*(K27-K28)/(J26+1))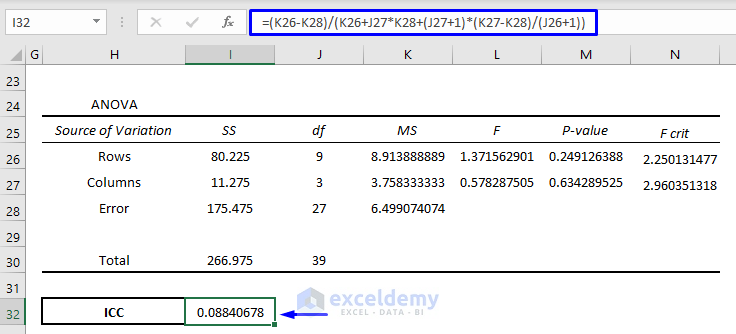
- The Intraclass Correlation Coefficient (ICC) for our dataset is 0.08840678.
The interpretation of the value of an Intraclass Correlation Coefficient (ICC) is as follows:
- Less than 0.50 -> Poor reliability
- Between 0.5 and 0.75 -> Moderate reliability
- Between 0.75 and 0.9 -> Good reliability
- Greater than 0.9 -> Excellent reliability
Read More: How to Calculate Spearman Correlation in Excel
Download the Workbook
Related Articles
- How to Calculate P Value for Spearman Correlation in Excel
- How to Show Relationship Between Two Variables in Excel Graph
- How to Calculate Pearson Correlation Coefficient in Excel
- How to Find Coefficient of Determination in Excel
- How to Find Correlation Coefficient in Excel Scatter Plot
- How to Find Spearman Rank Correlation Coefficient in Excel
<< Go Back to Correlation Coefficient in Excel | Excel Correlation | Excel for Statistics | Learn Excel
Get FREE Advanced Excel Exercises with Solutions!
