
Excel is a powerful tool widely used in financial modeling to analyze and predict financial performance. Whether you’re an analyst, business owner, or student, mastering financial modeling basics can enhance decision-making capabilities. Financial modeling involves creating a numerical representation of a company’s financial performance to forecast future results and inform strategic decisions.
This tutorial will show you how to use Excel for financial modeling.
Step 1: Understand the Objective
Clearly define the purpose of your financial model. Common objectives include:
- Forecasting revenue.
- Budgeting and expense management.
- Investment analysis.
- Evaluating business performance.
Step 2: Organize Your Spreadsheet
Proper structuring your spreadsheet is critical. Set your Excel sheet into clear sections.
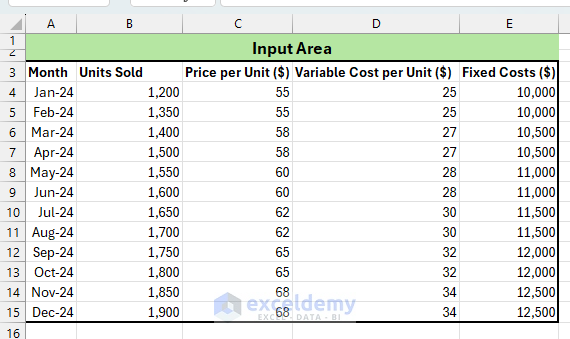
- Inputs: Clearly separate inputs (assumptions and raw data).
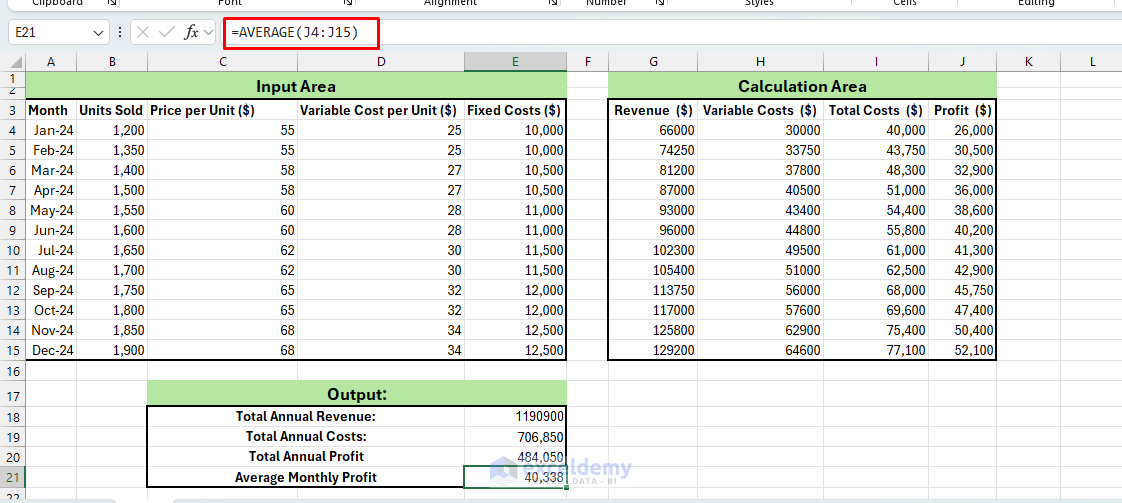
Let’s use a structured and realistic financial dataset representing monthly sales, pricing, costs, and fixed costs.
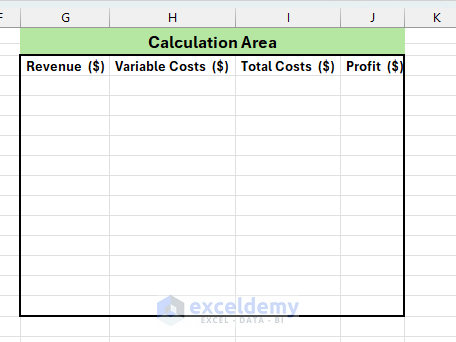
- Calculations: Use dedicated sections or sheets for formulas.
Create columns to calculate revenue, total variable costs, total costs, and profit.
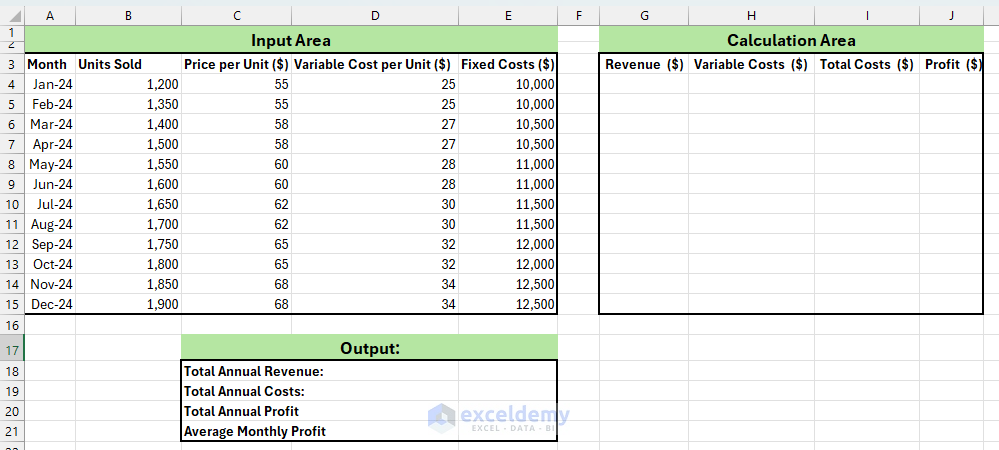
- Outputs: Summarize key results clearly.
Below your calculations, summarize key metrics.
Step 4: Use Essential Formulas
Basic Formulas for Financial Modeling:
Get comfortable with foundational Excel formulas:
- SUM: For totals (=SUM(range))
- AVERAGE: For average values (=AVERAGE(range))
- IF statements: Conditional scenarios (=IF(condition, value_if_true, value_if_false))
- VLOOKUP: For retrieving data from tables (=VLOOKUP(value, table, column_index, FALSE))
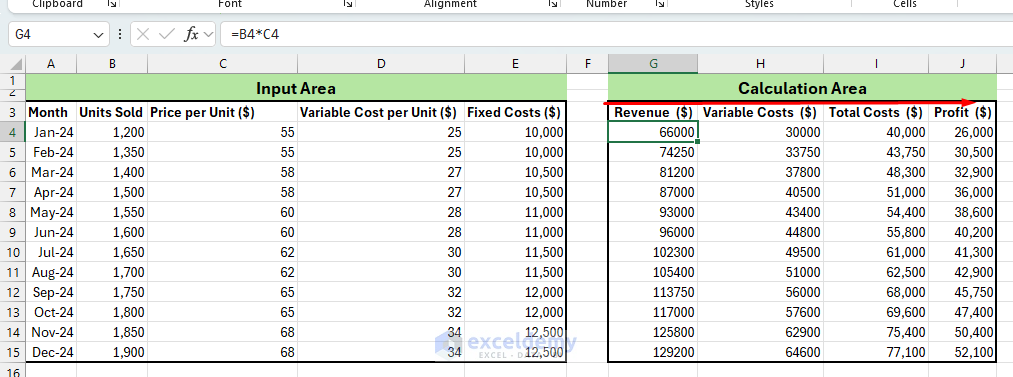
Implement Formulas in the Calculations Area:
Revenue (G4):
- Multiply Units Sold by the Price Per Unit.
=B4*C4
Variable Costs (H4):
- Multiply Units Sold by Variable Cost per Unit.
=B4*D4
Total Costs (I4):
- Add Variable Costs and Fixed Costs.
=H4+E4
Profit (J4):
- Subtract Total Costs from Revenue.
=G4-I4
- Drag these formulas from row 4 to 15 to calculate all months.
Step 5: Summarize Your Financial Model
At the end of the monthly table, include totals and averages:
- Total Annual Revenue:
=SUM(G4:G15)
- Total Annual Costs:
=SUM(I4:I15)
- Total Annual Profit:
=SUM(J4:J15)
- Average Monthly Profit:
=AVERAGE(J4:J15)
Step 6: Enhance Your Financial Model
Using Cell References:
- Always refer to input cells rather than hard-coding numbers into formulas.
- For instance, avoid =50*1000, use =B2*B3. This allows easy updates and better model flexibility.
Scenario Analysis:
- Use Excel’s scenario manager to quickly view how different inputs affect your profitability.
- You can also manually test different scenarios by simply changing input values and observing outputs.
Step 7: Tips & Best Practices
- Clearly separate inputs, calculations, and outputs for readability.
- Add comments or notes to explain assumptions.
- Use consistent formatting (colors, fonts, number formats).
- Validate your model regularly by checking with known results or scenarios.
Conclusion
By following the above steps, you can create financial models in Excel. Financial modeling enables clarity, flexibility, and quick decision-making. With sensitivity and scenario analysis, you can evaluate risk, opportunity, and business viability all within a single workbook. Begin with simple models, gradually incorporating complexity as your confidence grows.
Get FREE Advanced Excel Exercises with Solutions!
