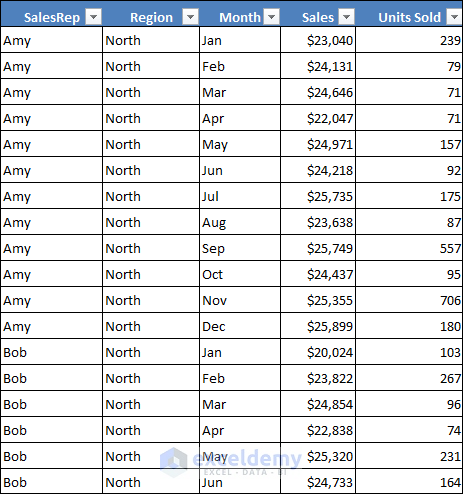
The table we’ll use consists of five columns and 48 rows. Each row of the table contains the monthly sales amount for a particular sales representative. For example, Bob is a sales representative for the North region, he sold 267 units in the month of February, and his total sales were $23,882. We’ll use the dataset to demonstrate how you can use calculated fields for averages in a pivot table.
What Is Calculated Field in Excel Pivot Table?
A calculated field is an alternative to creating a new column field in your source data. In most cases, you will find that it is easier to create a new column field in your source data with a formula that performs the expected calculation. But when your data is from an external source and you can’t manipulate the data source, you can use the calculated field feature.
Pivot Table Calculated Field for Average in Excel with Easy Steps
The following figure shows a pivot table created from the table. To create this pivot table, we have placed the Month field in the Rows area, the SalesRep field in the Columns area, and the Sales field in the Values area.
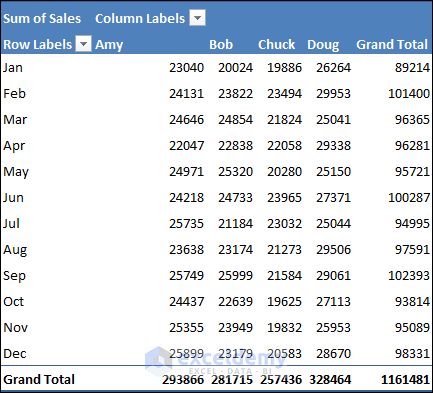
We are going to add a new field to the pivot table that will show the average unit price.
Steps:
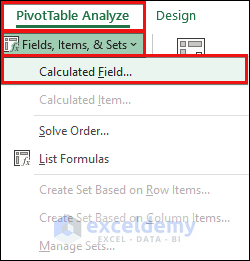
- Select any cell within the pivot table to access the PivotTable Analyze feature.
- Choose PivotTable Analyze ➪ Calculations ➪ Fields, Items & Sets ➪ Calculated Field.
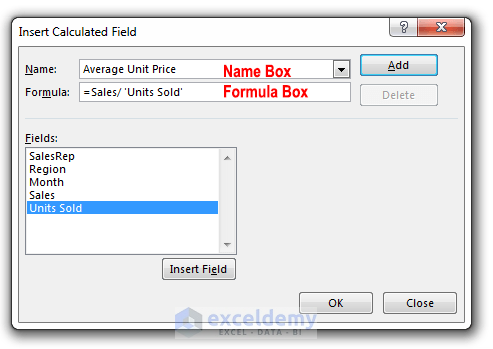
- The Insert Calculated Field dialog box will appear.
- There are two fields in the dialog box. One is Name Box and another is Formula Box.
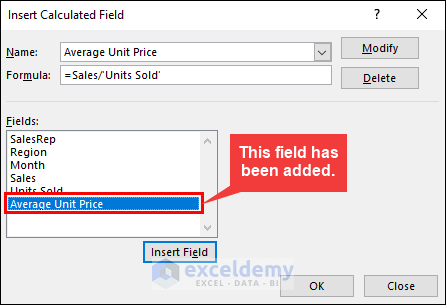
- Enter a descriptive name in the Name Box and input the formula in the Formula Box. The formula can use any worksheet function and use any fields from the data source. In our example, we have entered Average Unit Price in the Name box, and this formula in the Formula box: =Sales/’Units Sold’.
- Click the Add button in the dialog box to add this new field in the Fields section.
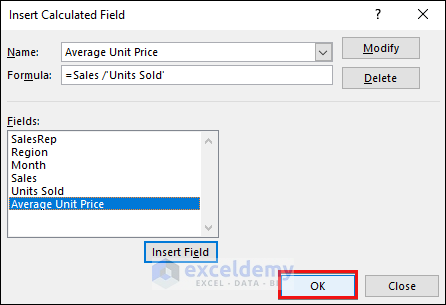
- Click OK to close the Insert Calculated Field dialog box.
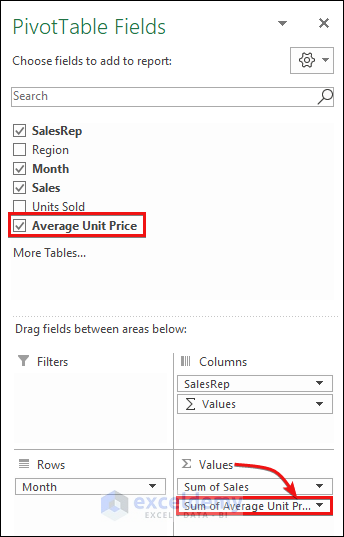
- After you have created the calculated field (Average Unit Price), Excel automatically adds this field as a new column in the pivot table with its calculated values. The calculated field also appears in the PivotTable Fields task pane. You can treat this new field just like any other field, but you can’t move it to the Rows, Columns, or Filters areas like other fields. This field must remain in the Values area.
- The following figure shows the pivot table after we have added the calculated field Average Unit Price. To shorten a label and make it more visible, select it, press F2, and change the label. We have applied some styling for better visualization.
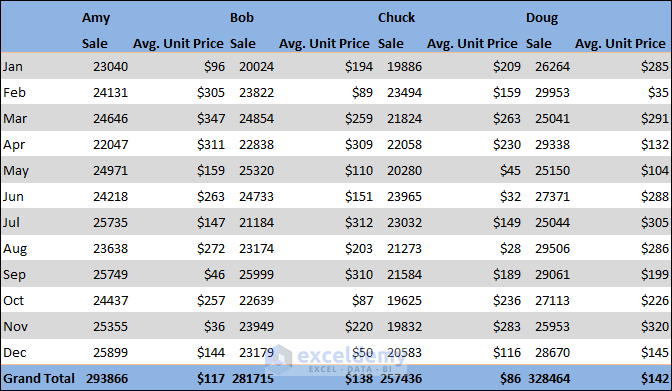
The pivot table with a calculated field.
Read More: How to Calculate Weighted Average in Excel Pivot Table
Download the Practice Workbook
Related Articles
- Calculated Field Sum Divided by Count in Pivot Table
- How to Get a Count in Excel Pivot Table Calculated Field
- How to Apply Excel COUNTIF with Pivot Table Calculated Field
- How to Calculate Variance Using Pivot Table in Excel
<< Go Back to Calculated Field in Pivot Table | Pivot Table Calculations | Pivot Table in Excel | Learn Excel
Get FREE Advanced Excel Exercises with Solutions!
