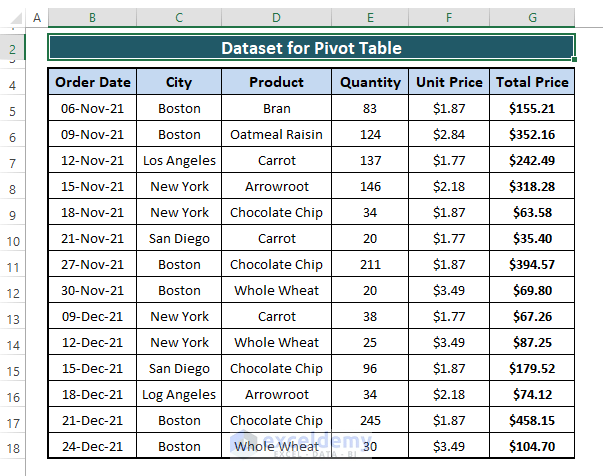
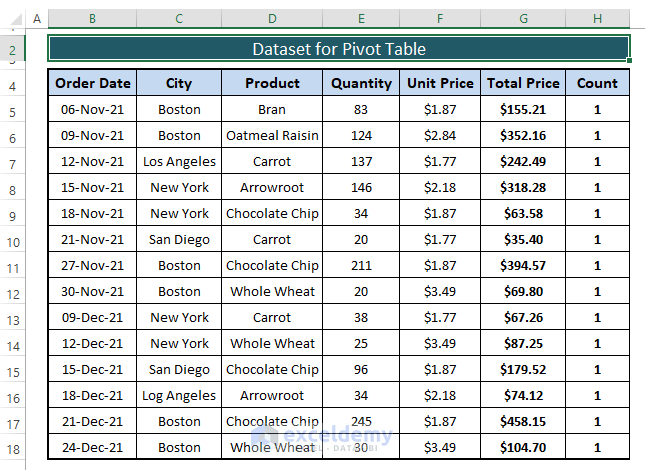
Below, we have sales in amounts of different cities in a dataset. We want to calculate the average sale amounts of each city with or without imposed conditions. We can achieve this using the Pivot Table Calculated Field Sum, then dividing the Sum by the Total Sale Count.
What is the Calculated Field in the Pivot Table?
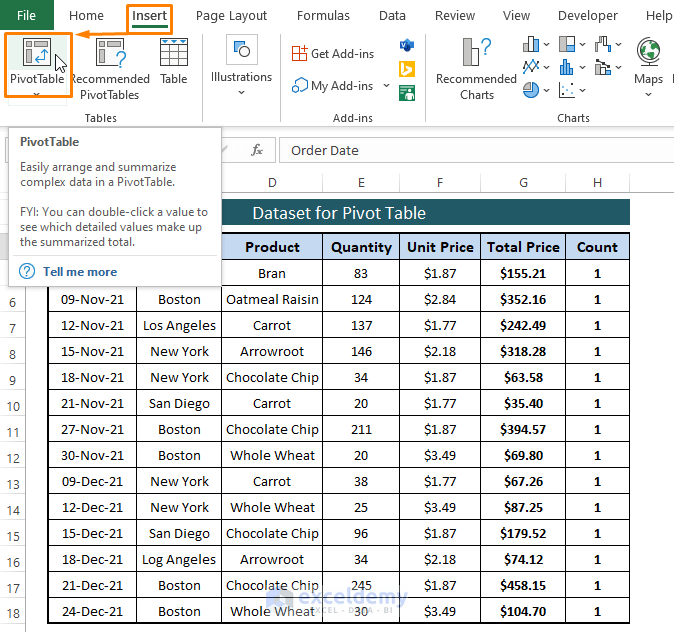
For any dataset or range of data, we can insert a Pivot Table by going simply to the Insert tab > selecting Pivot Table from the Tables section.
All the entries in the Pivot Table are either text or number values. If we place the cursor on any entry, the PivotTable Analyze ribbon appears.
Issues with Calculating Field
The Pivot Table Calculated Field feature calculates the sum of other values. Nonetheless, the other values result from another execution, and the Calculated Field considers them summable.
For example, we have a Pivot Table where, for each city, there are multiple Order Dates.
We want to insert a Calculated Field that obeys the formula =’Order Date’ >3 as shown in the following image.
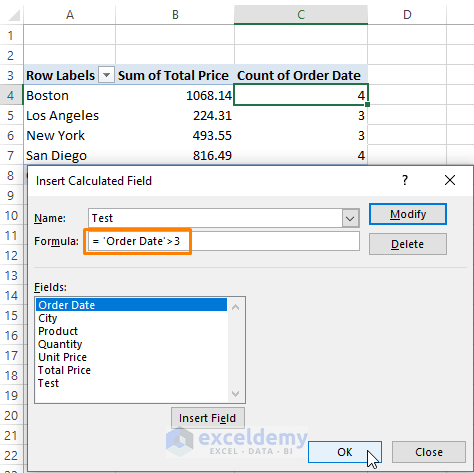
After applying the formula, we get the same result as True (i.e., 1) for each city depicted in the screenshot below. This is an issue. Test results should be 0 for Los Angeles and New York cities as they don’t satisfy the condition.
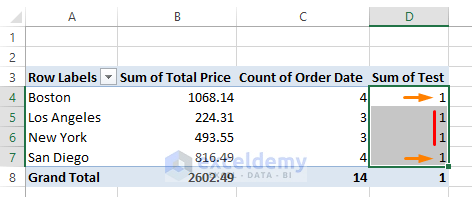
The Pivot Table Calculated Field does that because the date field uses the COUNT function, and dates are added, whereas they should be counted.
To overcome this limitation of the Calculated Field, we must use a helper column as a count. Using the count column instead of the date, we’ll face no issue regarding the average calculation using the Calculated Field.
Inserting a Helper Column
STEPS:
- Insert an extra column adjacent to the main dataset, and enter 1 in each cell.
- Use the Fill Handle to insert 1 in cells.
Inserting a Pivot Table
STEPS:
- Go to the Insert tab and Select Pivot Table (from the Tables section).
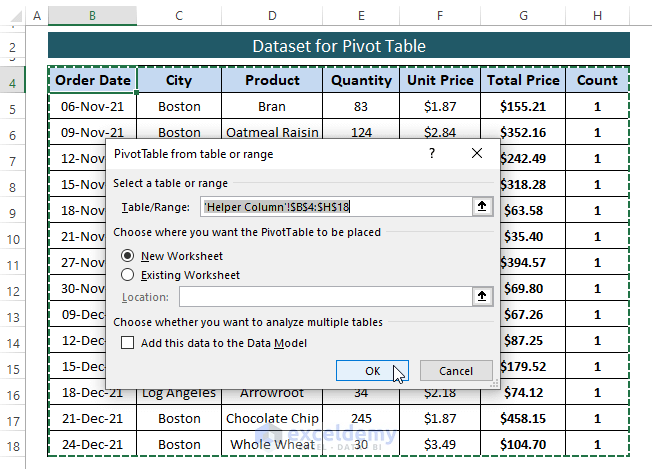
- Executing Step 1 will automatically select the table range.
- Select a different range according to your needs.
- Mark the New Worksheet option.
- Click OK.
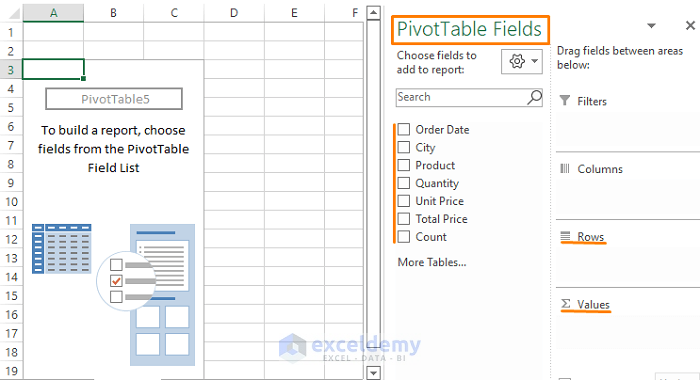
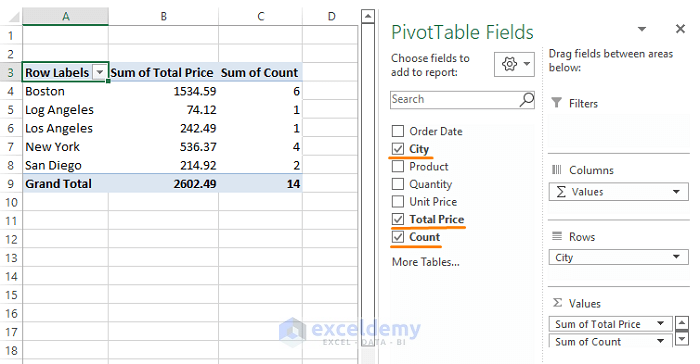
The above two steps make the Pivot Table appear, as shown in the image below.
Adding Fields to the Pivot Table
STEPS:
- Tick the fields (e.g., City, Total, and Count) you want in the Pivot Table and place them in the Rows or Values section.
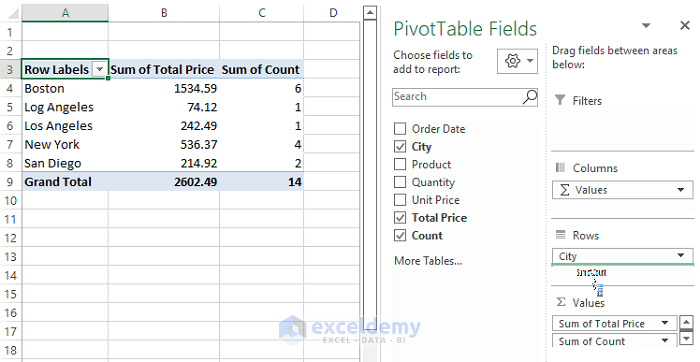
- Drag any fields around the Rows, Columns, or Values section as depicted in the following picture.
Inserting a Calculated Field
STEPS:
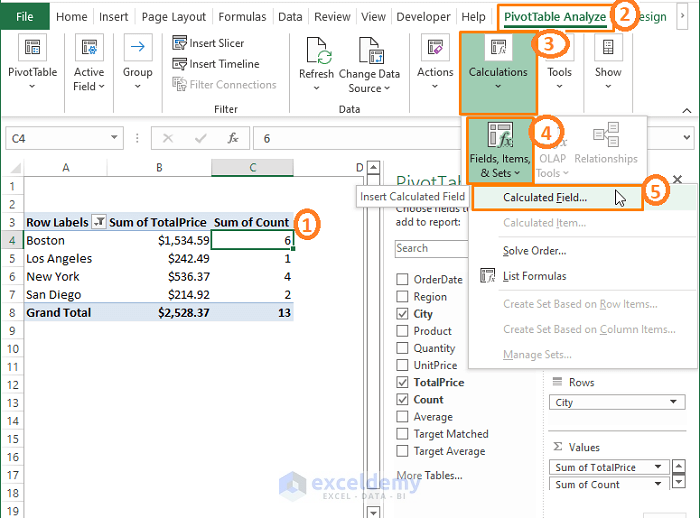
- Click on any values in the Pivot Table. The PivotTable Analyze ribbon appears.
- Go to PivotTable Analyze ribbon > Select Fields, Item & Sets (from the Calculations section).
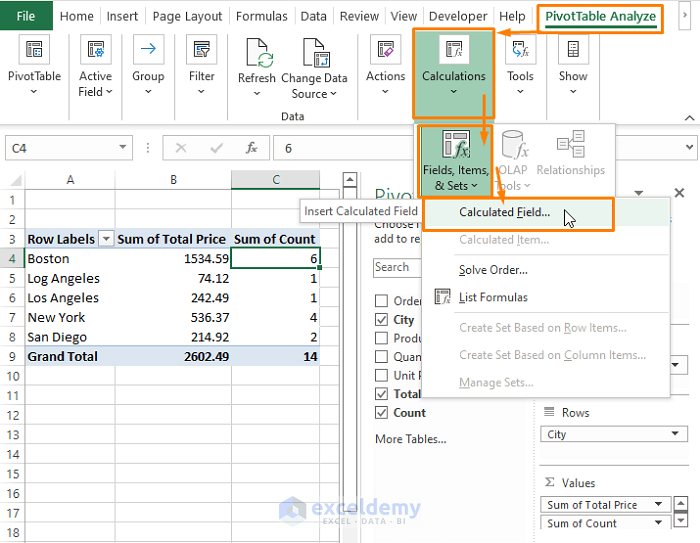
- The Insert Calculated Field window pops up.
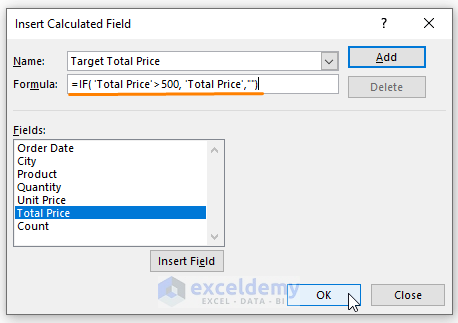
- In the Insert Calculated Field window, Give the field a suitable Name (i.e., Target Total price).
- Enter a formula (i.e., IF formula).
- To enter any existing field, Select any field under the Fields section.
- Click on Insert Field.
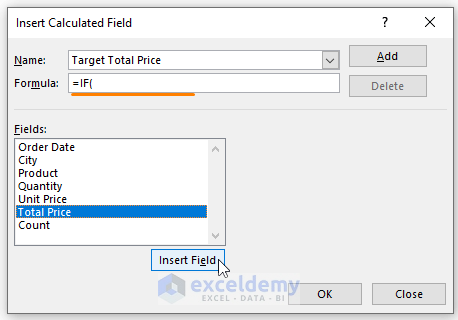
- Enter the following formula in the Insert Calculated field:
=IF('Total Price'>500,'Total Price',"")-
- In the formula, we impose a condition using the IF function that we want Total Price amounts larger than 500.
- Click OK.
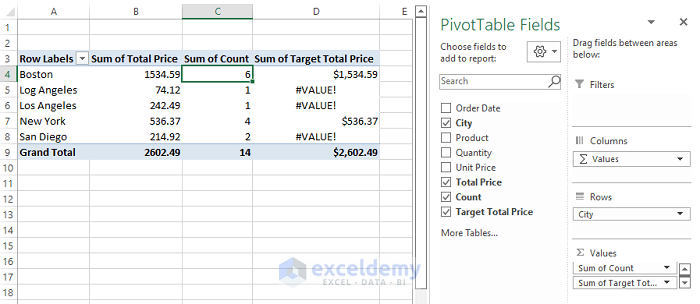
- After clicking OK, the Target Total Price amounts appear in the Sum of Target Total Price calculated pivot table field in the screenshot below.
Calculated Field Sum Divided by Count
STEPS:
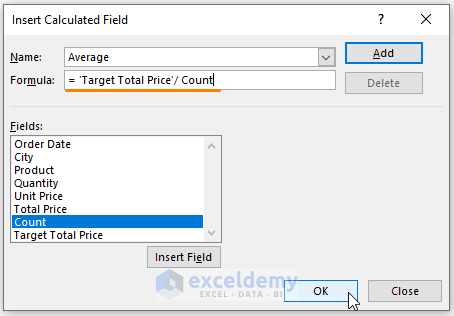
- Give this calculated field a name (i.e., Average).
- Enter the basic Average formula (i.e.,
Average=Target Total price/Count) as in the screenshot. - Click OK.
- You see the average values as we divide the calculated field sum by the count. The latter illustration shows the Checked fields’ outcomes in a Pivot Table.
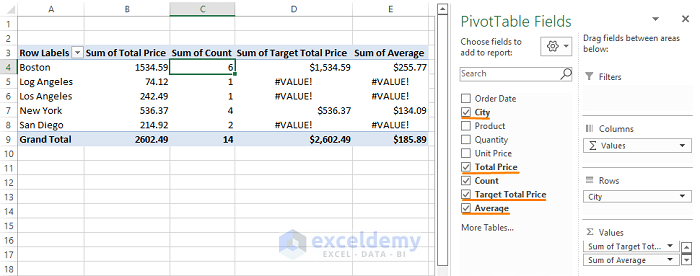
In the Pivot Table, we can achieve the average or Total Sum divided by Count in multiple alternative ways. However, the Calculated Field Sum divided by Count is knowingly calculable by adding a helper column, making each entry unique and countable by the Pivot Table. Otherwise, the Issue with the Calculated Field happens.
Read more: How to Get a Count in Excel Pivot Table Calculated Field
Alternative Way to Calculate the Average in a Pivot Table (without Calculated Field)
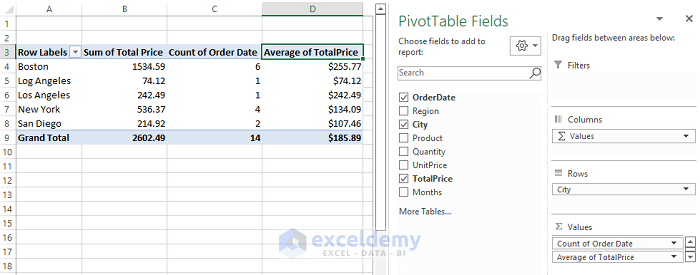
STEPS:
- Insert a Pivot Table following Inserting a Pivot Table‘s sequences. The below picture shows a typical Pivot Table with fields.
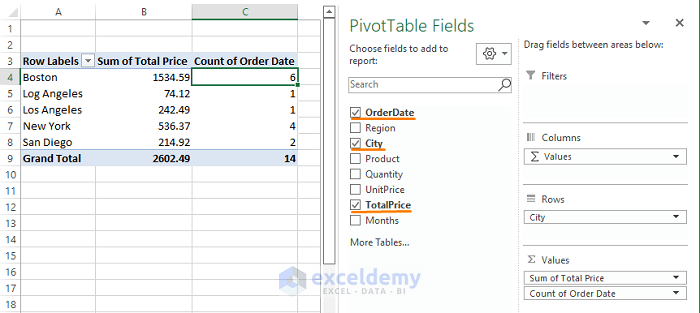
- Add an extra identical Sum of Total Price field in the Values section.
- Drag the field to the Values section to add the field to the Values section.
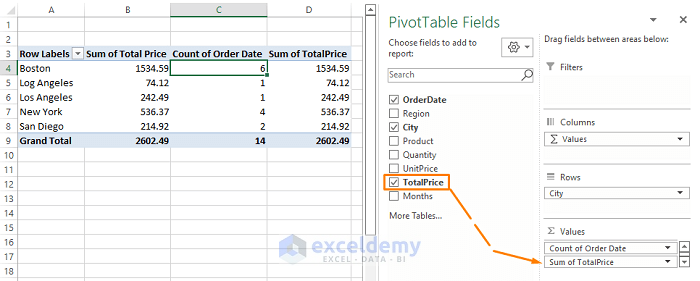
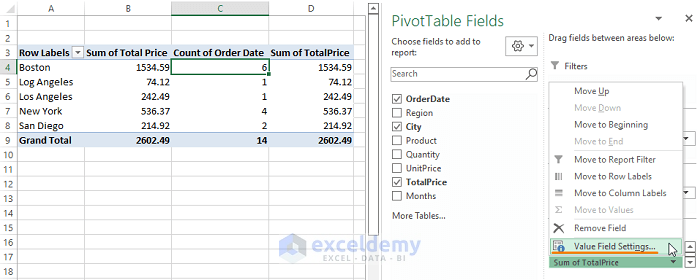
- Right-click on the added field in the Values section (i.e., Sum of Total Price).
- Select Value Field Settings (from the Context Menu options).
- Choose any calculation (i.e., Average) under Summarize value field by.
- Click OK.
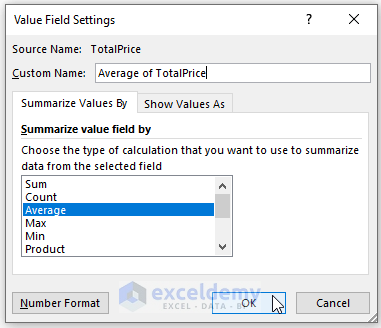
- The Average of the Sum Total Price value appears.
Read More: How to Calculate Weighted Average in Excel Pivot Table
⧭ Note: Remember that Calculated Fields and typical Pivot Table Fields are not the same. Calculated Fields are inserted fields that don’t exist in the Dataset.
Download the Excel Workbook
Related Articles
- Pivot Table Calculated Field for Average in Excel
- How to Apply Excel COUNTIF with Pivot Table Calculated Field
- How to Calculate Variance Using Pivot Table in Excel
<< Go Back to Pivot Table Calculations | Pivot Table in Excel | Learn Excel
Get FREE Advanced Excel Exercises with Solutions!
