What Is Average Percentage Increase
The average growth per period over a number of periods is called the average percentage increase.
The formula for percentage increase is:
Percentage increase in a period = ( Value at the end of the period - Value at the beginning of the period)/ Value at the beginning of the periodThe formula for average percentage increase:
Average percentage increase = Summation of percentage increase in all the period/ Number of periodMethod 1 – Calculating Percentage Increase for First Period
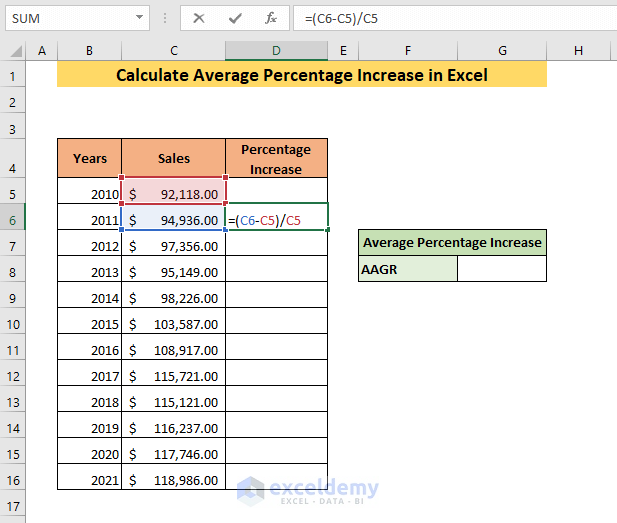
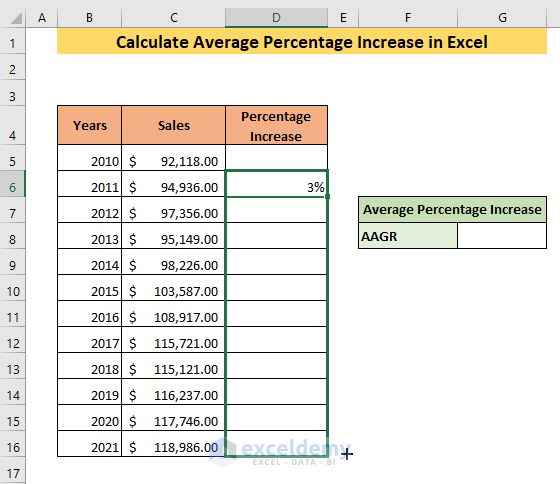
Enter the following formula in cell D6.
=(C6-C5)/C5The formula will find the difference between the sales at the end of the year 2011 and the sales at the end of the year 2010. It will divide the difference with the sales value at the end of the year 2010.
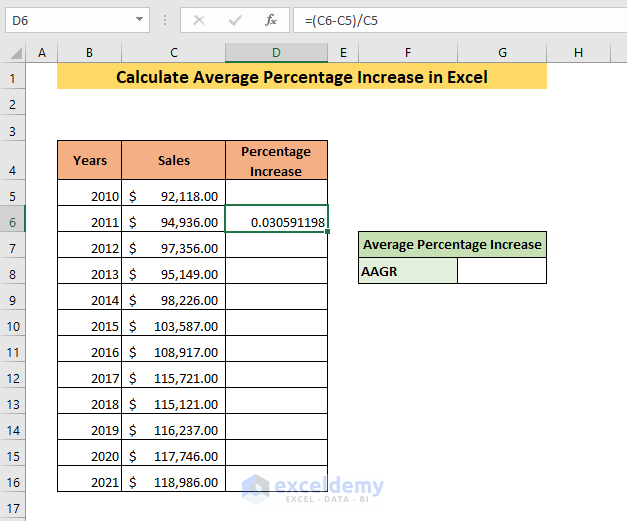
➤ Press ENTER and you will get the sales increase in 2011.
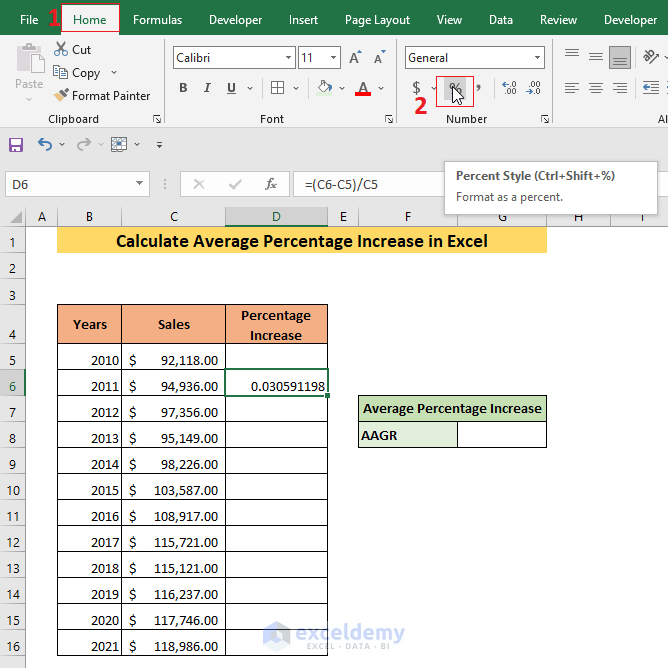
➤ To get the percentage increase, go to the Home tab and click on the Percent Style icon from the Number tab.
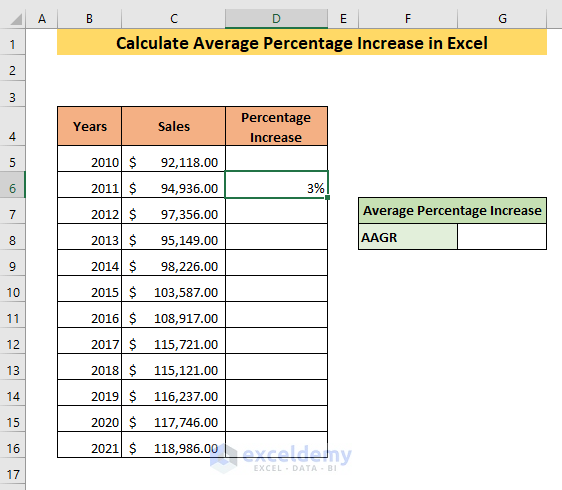
The result will show the sales increase in percentage.
Read More: How to Calculate Price Increase Percentage in Excel
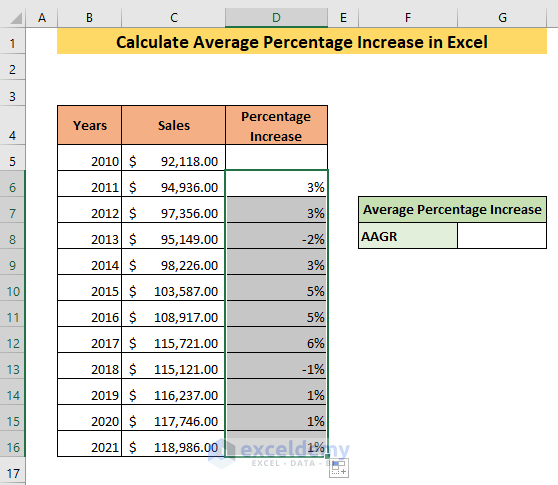
Method 2 – Determining Percentage Increase in All Periods
➤ Select cell D6 and place the cursor in the bottom right corner of the cell.
➤ The cursor will turn into a plus sign. Drag cell D6 to the end of your dataset.
The formula will be applied in all the cells and you will get the percentage increases for all the periods.
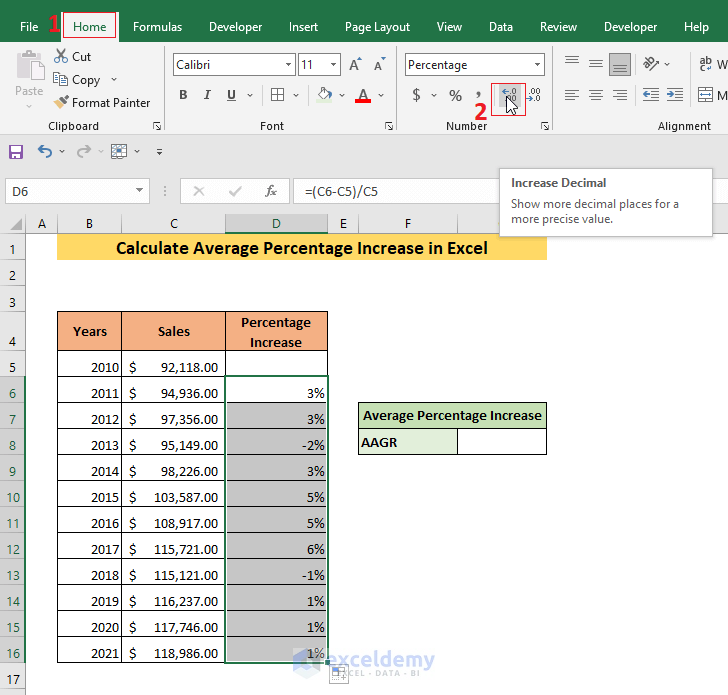
If you notice, the percentage numbers are showing only one digit. Excel approximates the total number to one digit. The percentage increase is a very small number. So, when it is approximated to one digit, you may not get the accurate value. Add more digits to the numbers.
➤ Go to the Home tab and click on the Increase Decimal icon.
One additional digit will be added to the selected numbers per click.
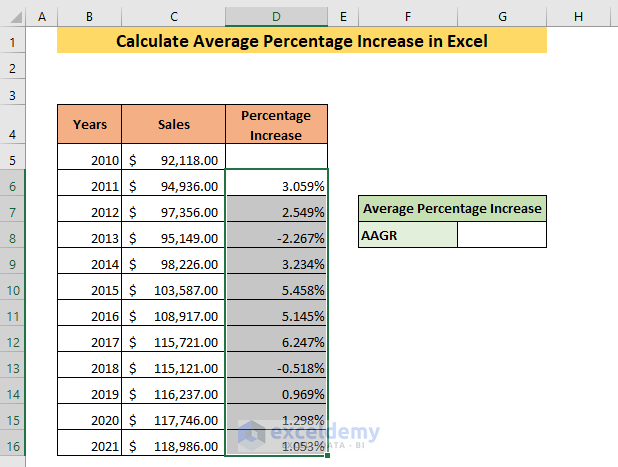
I have clicked the Increase Decimal icon thrice.
Read More: How Do You Calculate Percentage Increase or Decrease in Excel
Method 3 – Calculating Average Percentage Increase in Excel
➤ Enter the following formula.
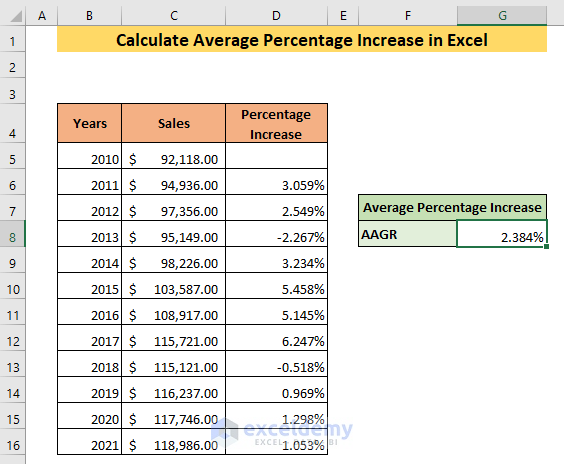
=AVERAGE(D6:D16)The AVERAGE function will give you the average of all of the percentage increases.
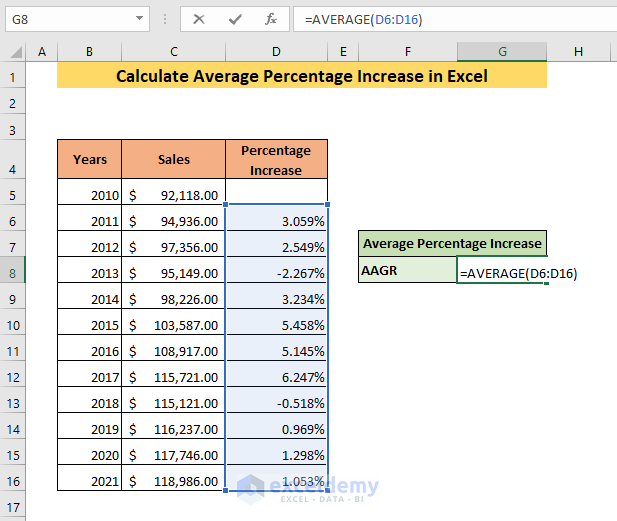
➤ Press ENTER.
The result will show the average percentage increase of the sales.
Read More: How to Calculate Percentage Increase from Zero in Excel
Download Practice Workbook
Related Article
<< Go Back to Percentage Change | Calculating Percentages | Calculate in Excel | Learn Excel
Get FREE Advanced Excel Exercises with Solutions!
