
Power BI is one of the most popular business intelligence tools for transforming, analyzing, and visualizing data. But its real magic comes from DAX (Data Analysis Expressions). DAX is a formula language that lets you create custom calculations and metrics in Power BI, making your reports dynamic and insightful.
In this tutorial, we will guide beginners to use Power BI DAX expressions along with the basics of DAX, its core concepts, and practical examples to help you get started.
What is DAX?
DAX (Data Analysis Expressions) is a formula language used in Power BI, Excel Power Pivot, and SQL Server Analysis Services. It allows you to create new information from data already in your model. You can think of DAX as Excel formulas, but supercharged for relational data and interactive dashboards.
DAX Syntax:
DAX syntax follows these basic rules:
- DAX functions follow the pattern FUNCTION(argument1, argument2, …).
- Table and Column References:
- Reference a column: TableName[ColumnName].
- Reference an entire table: TableName.
- Comments: Use // for single-line comments or /* */ for multi-line comments.
- Operators:
- Arithmetic: +, -, *, /, ^
- Comparison: =, <>, <, >, <=, >=
- Text: & (concatenation)
- Logical: && (AND), || (OR), ! (NOT)
Key DAX Concepts
- Create Calculated Columns: DAX allows you to create calculated columns based on existing columns.
- Computed row by row.
- Stored and added to tables.
- Like new columns in Excel.
- Create Measures: Dynamic calculations (like SUM, AVERAGE, or custom aggregations) that adapt to filters and slicers in reports.
- Computed on the fly, not stored.
- Used in visuals and aggregates.
- Like dynamic summary formulas.
- Build Custom Tables: Create new tables derived from existing ones.
- Handle Date Intelligence: Calculate YTD, QTD, moving averages, etc.
When to use:
- Use a calculated column when you need the result in each row.
- Use a measure when you want dynamic calculations that change with filters.
Getting Started: Your First DAX Expressions
Let’s use a simple Sales table to help you understand Power BI DAX expressions.
Create a Calculated Column
Calculated columns are computed row by row and stored in your data model. They’re useful for categorizing data or creating lookup values.
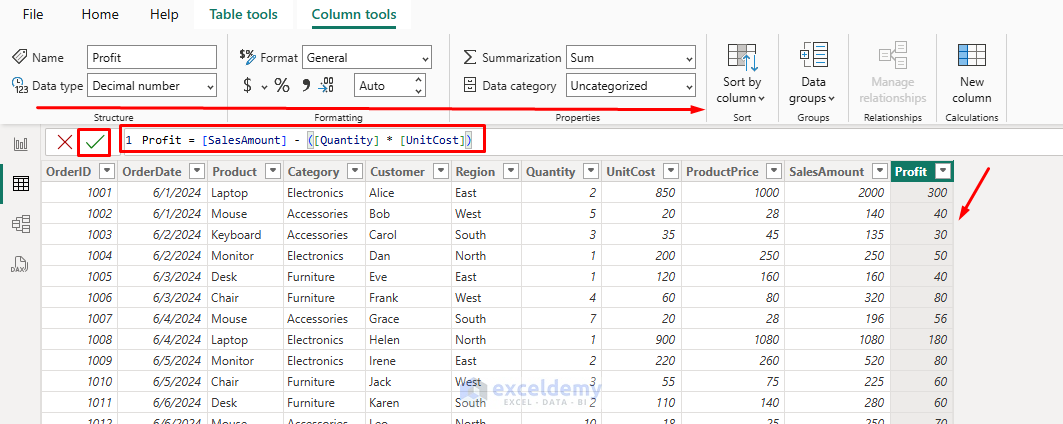
Let’s create a profit column.
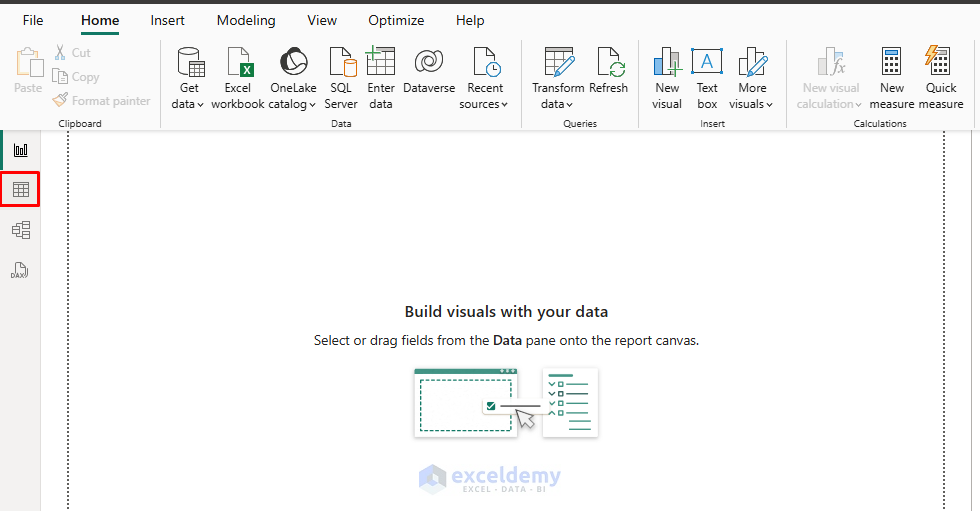
- Go to Table view from the left navigation pane.
- Go to the Table Tools tab >> select New column.

- Insert the following DAX expression.
DAX Expression:
Profit = [SalesAmount] - ([Quantity] * [UnitCost])
This calculates profit per transaction by subtracting the total cost (quantity × unit cost) from the sales amount.
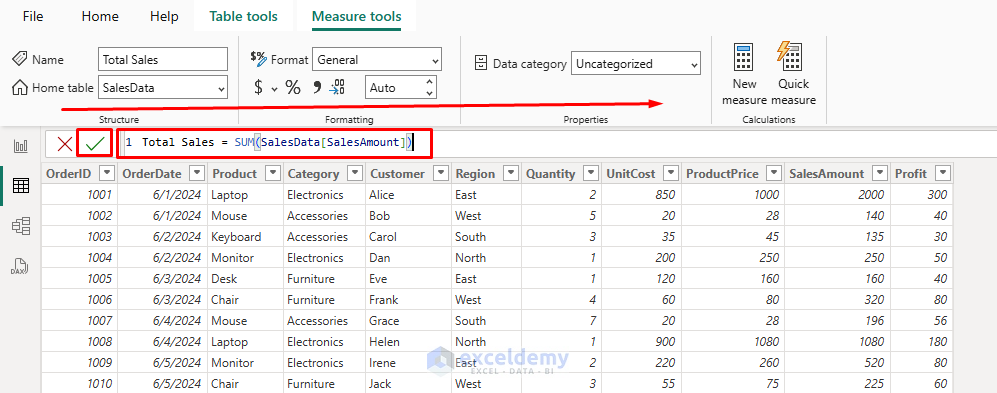
Create a Measure
Measures are dynamic calculations that change based on the filter context in your reports. They’re the backbone of most DAX calculations.
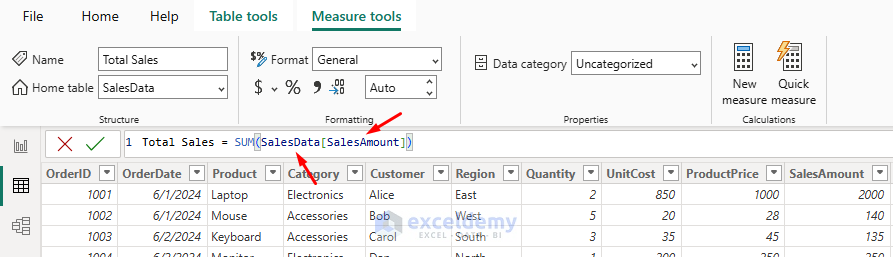
Let’s calculate the total sales amount.
- Go to the Table Tools tab >> select New measure.
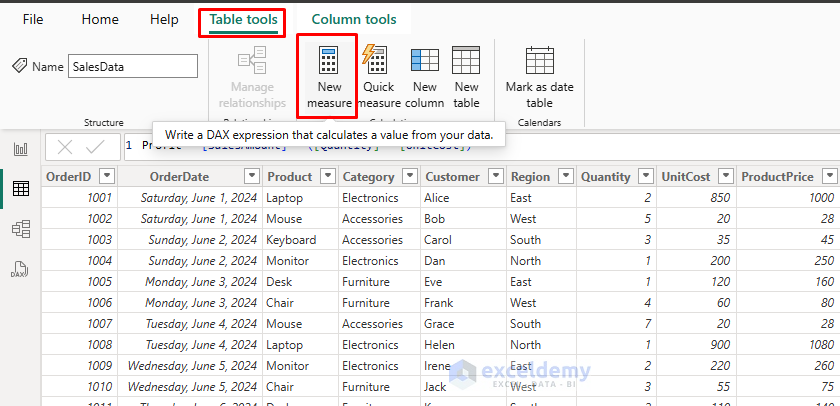
- Insert the following DAX expression.
DAX Expression:
Total Sales = SUM(SalesData[SalesAmount])
This calculates the sum of all sales amounts, automatically recalculating when filtered by products or dates.
Explore Practical DAX Expressions
Common DAX Functions:
Profit Margin Measure: A more complex measure that calculates profit margin.
Profit Margin % = DIVIDE(SUM([Profit]),SUM([SalesAmount]),0) * 100
The DIVIDE function safely handles division by zero by returning 0 when the denominator is zero.
Unique Customers: Count unique customers.
Customer Count = DISTINCTCOUNT([Customer])
- Shows how many unique customers you have.
Average Sales per Order:
Average Sales per Order = AVERAGE([SalesAmount])
Conditional Logic Using DAX (IF Statement):
Use DAX for conditional logic, such as labeling sales performance:
Sales Performance: Create a calculated column.
Sales Performance = IF([Profit] > 100, "High Profit", "Low Profit")
Sales for Specific Region:
North Region Sales =
CALCULATE(
SUM(SalesData[SalesAmount]),
SalesData[Region] = "North"
)
Count of High-Value Orders:
High Value Order Count =
CALCULATE(
COUNT(SalesData[OrderID]),
SalesData[SalesAmount] > 500
)
Time Intelligence in DAX:
DAX includes specialized functions for date-based analysis.
Year-to-Date Sales:
YTD Sales = TOTALYTD(SUM([SalesAmount]), SalesData[OrderDate])
Previous Year Same Period:
Sales PY = CALCULATE(
SUM(([SalesAmount]),
SAMEPERIODLASTYEAR(SalesData[OrderDate])
)
Year-over-Year Growth:
YoY Growth % =
DIVIDE(
[SalesAmount] - [Sales PY],
[Sales PY],
0
) * 100
Test Created Measure:
You can validate the created column in the data table, but to validate the created measure, you can use it in the report visuals.
- Go to the Report view.
- Select the Card from the Visualizations pane.
- Drag created Measures to the Value fields.

Tips for DAX Beginners
- Column vs Measure: Remember, columns are for row-level calculations, measures for aggregations.
- Context Matters: Measures react to filters/slicers, test them in visuals!
- Helps: Use Power BI’s formula bar suggestions.
- Debug Step by Step: Create simple measures, then build complexity.
- Documentation: The Official DAX Reference is your best friend.
Conclusion
DAX is the core of Power BI’s analytical power. By mastering basic expressions, calculated columns, and measures, you can unlock a whole new world of data insights. This beginner’s guide gives you foundational skills to confidently start using DAX expressions. With consistent practice, you’ll soon master Power BI’s powerful analytical capabilities. Start experimenting with your datasets, and writing DAX will feel as natural as building formulas in Excel.
Get FREE Advanced Excel Exercises with Solutions!
