Latest Posts From Sowmik Chowdhury

We have a dataset with a list of products that fall into three categories and their Sales Quantity. The categories are Laptop, Headphone, and Smartwatch. We ...

Watch Video – Create an Area Chart in Excel Example 1 - Make a Simple 2-D Area Chart in Excel Steps: Select range B6:E12. Cell B6 is the ...

The dataset below showcases the Sales Quantity of three different laptop models over different weeks. To compare Sales Quantity, use a Bar Chart: ...

In many cases, we might need to create a scatter plot with multiple series of data. The next thing we need to do after creating such a type of scatter plot is ...
We have a dataset with a list of people and the percentage of their Task Completed. We'll add progress bar to track their progress. Method 1 - Using ...
In many cases, we may need to track the cell changes in Microsoft Excel. We can track cell changes using an Excel formula. This is a very convenient and faster ...
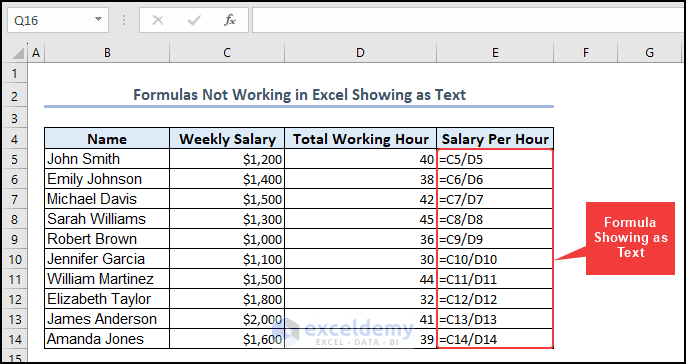
In the following image, you can see that the formula is not working and showing as text. The dataset showcases Name, Weekly Salary, Total Working Hour, ...
It is very necessary to track weight loss to keep fit and also not become sick. In Microsoft Excel, you can easily keep track of your weight loss and easily ...

Method 1 - Applying the FILTERXML and SUBSTITUTE Functions in Excel We have a dataset where there is a list of Countries and their respective cities ...

In many cases, you may need to consolidate, merge, or combine data. In Microsoft Excel, you can do such types of tasks in bulk and within seconds. This article ...

Labels are useful to us in a lot of ways. You can create labels in Excel with the help of Microsoft Word. But, in some cases, this may be a lot of hassle and ...

How to Create a Bank Statement Outline Using Data Organization Guidelines in Excel Create an organized outline for a Bank Statement using the Data ...

Method 1 - Showing Outliers in Box and Whiskers Chart Steps: Select range C5:C16. C5 and C16 are the first and last cells of the Brand Value column. ...

Mileage reimbursement calculation is one of the most common tasks in a business. You may also know mileage reimbursement as claim cost, or vehicle running ...

Suppose you have a candidate list for a voting program, and you want to calculate the votes for each of these candidates. In this case, you can use Excel to ...
See Our Reviews at

