Microsoft Excel is a powerful tool that can perform different mathematical operations. In this article, we will learn to solve a differential equation in Excel. A differential equation defines the relationship between one or more functions and their derivatives. Today, we will show step-by-step procedures to solve a differential equation in Excel. Using these steps, you can easily solve any differential equation in Excel. So, without any delay, let’s start the discussion.
What Is a Differential Equation?
A differential equation is an equation that contains one or more functions and the derivatives of one variable with respect to another variable. The differential equation can be written as:
dy/dx=f(x)We have different order differential equations. The highest order of the derivative is called the order of the differential equation. Differential equations are mainly used to calculate growth and decay over time. Also, these equations are used to create different models. We can also see a huge application of differential equations in the field of physics.
How to Solve Differential Equation in Excel: With Easy Steps
Today, we will demonstrate the procedures to solve a first-order differential equation using Euler’s method in Excel. Let’s take a look at the question we will be solving today.
Suppose, we have a differential equation dy/dt+y=t and an initial value y(0)=0.5. So, the equation can be written as dy/dt = t-y. We need to compute the y–values in a time interval (0,1.2). Let’s follow the steps below to see how we can solve the differential equation.
STEP 1: Create Dataset
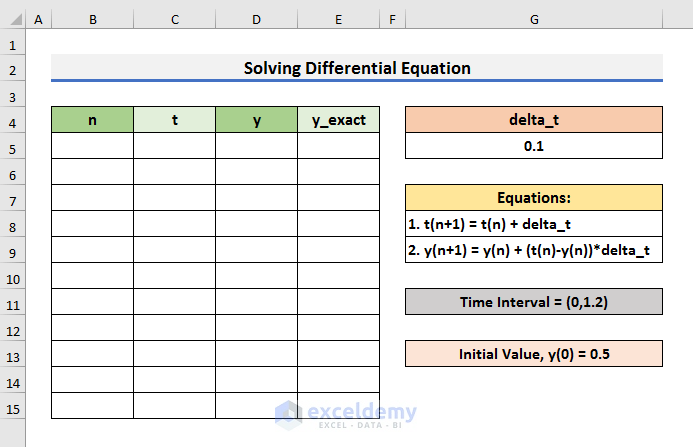
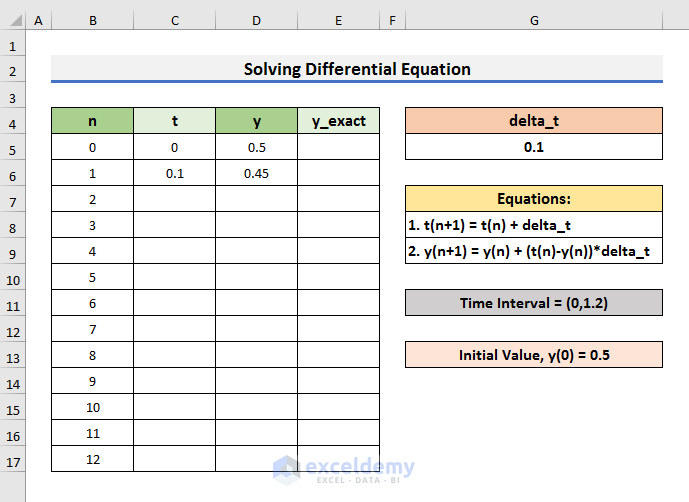
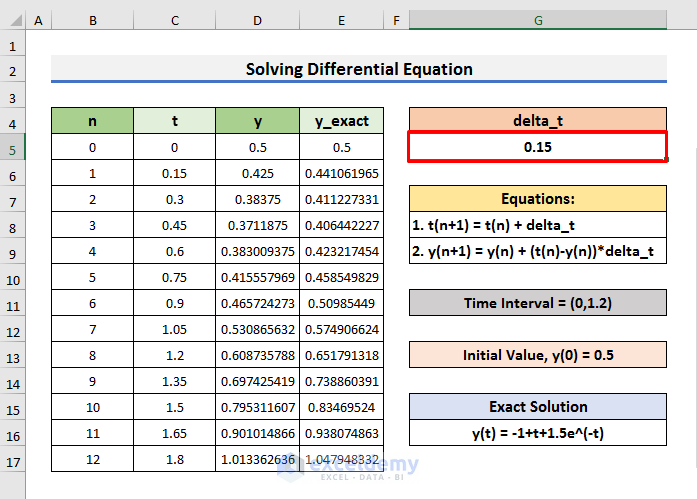
- Firstly, we need to create a dataset to insert the iteration number (n), time value (t), y value, y–exact value, and delta_t.
- The delta_t is the separation value.
- Also, you can display the equations to find the t(n+1) and y(n+1) values. We will implement these equations in the following sections.
- We have also added the time interval and initial value to make the calculation easy.
STEP 2: Apply Formula for Time Values & Y-values
- Secondly, we will apply formulas to calculate the time values and y-values.
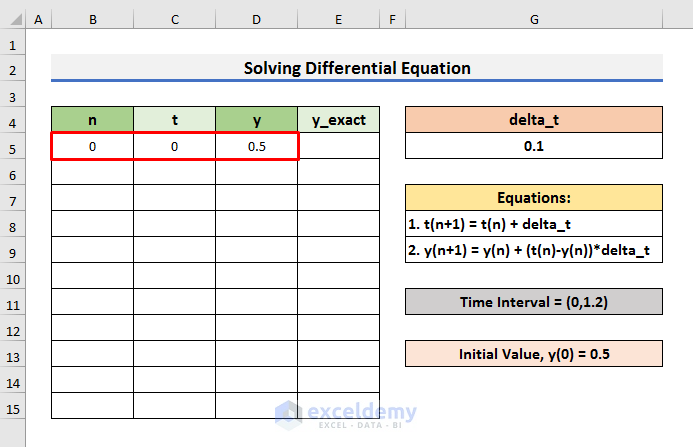
- At the start of the iteration, n is 0, t is 0, and y is 5.
- Now, insert these values in Cells B5, C5, and D5 respectively.
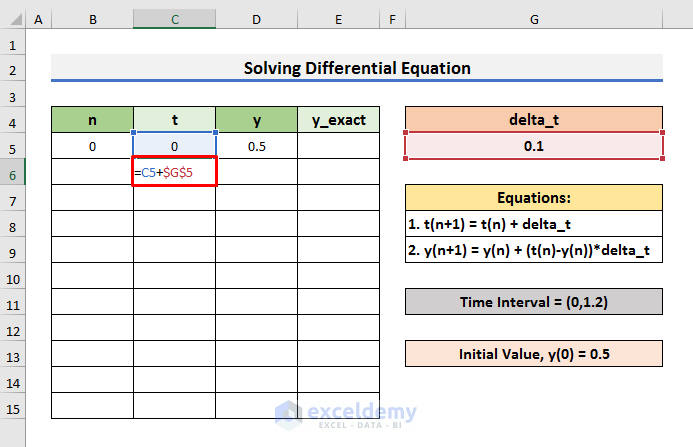
- After that, we will insert a formula to calculate the t-values.
- To do so, select Cell C6 and type the formula below:
=C5+$G$5- Press Enter.
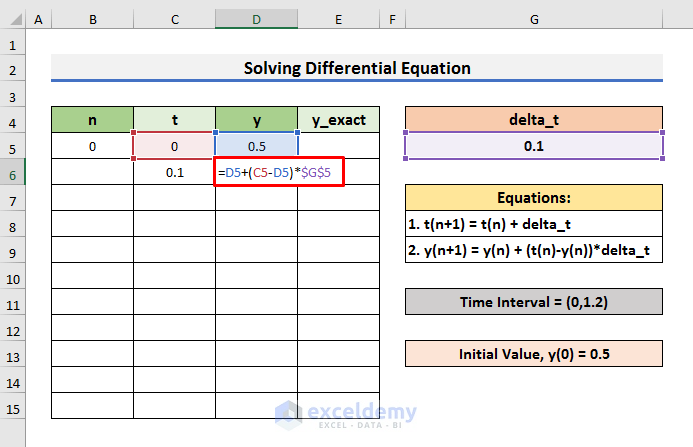
- In the following step, we will find the y-values.
- So, select Cell D6 and type the formula below:
=D5+(C5-D5)*$G$5- Press Enter to see the result.
STEP 3: Fill Columns
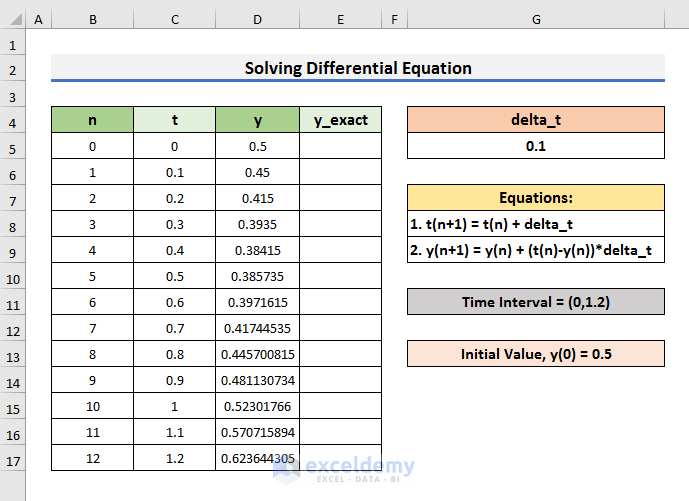
- In the third step, we will fill the values with the n, t, and y columns.
- Firstly, we will fill the iteration number (n) column.
- To find the number of iterations, we need to divide the time interval by the delta_t value.
- In our case, iteration number (n) = (2/0.1) = 12.
- So, we need to fill the iteration column from 0 to 12.
- After that, select both Cells C6 & D6 and drag the Fill Handle down.
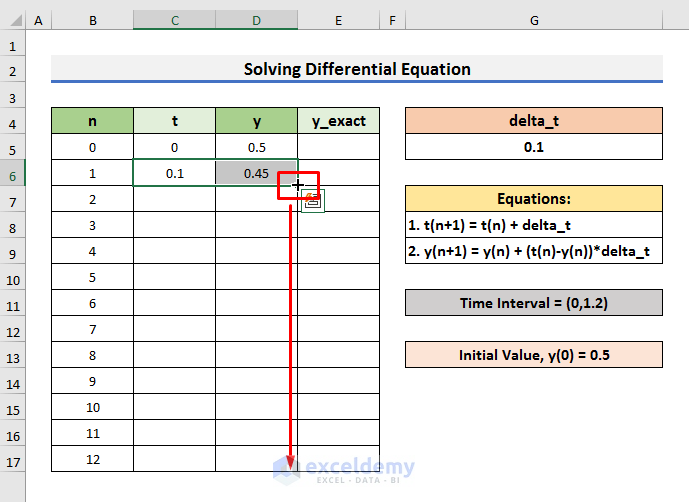
- Finally, you will get all the t and y–values.
STEP 4: Plot Data
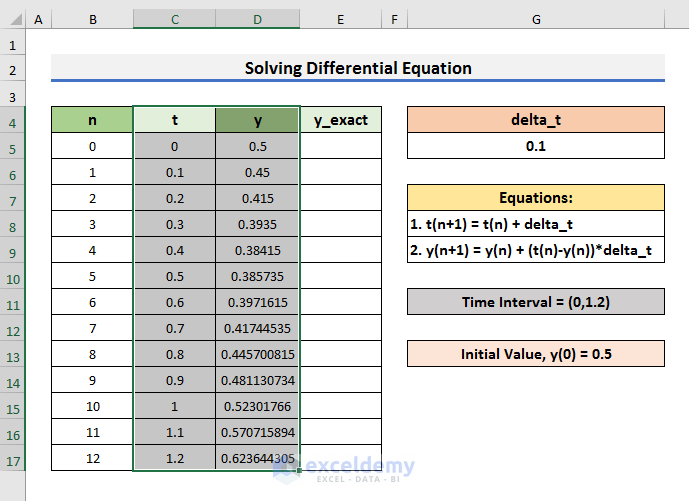
- At this moment, we need to plot the t and y–values.
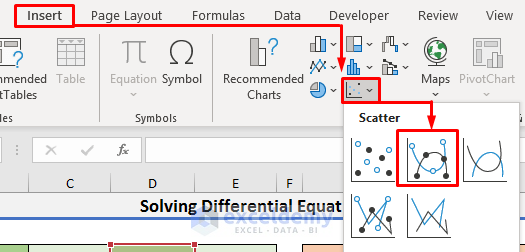
- For that purpose, select the range C4:D17.
- After that, go to the Insert tab and click on the Insert Scatter icon. A drop-down menu will appear.
- Select Scatter with Lines from there.
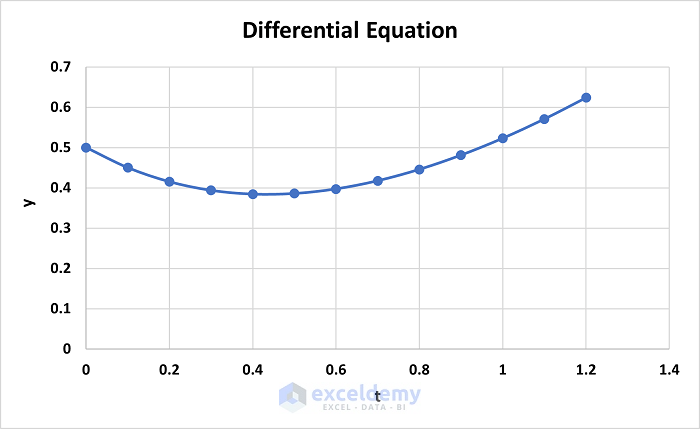
- As a result, you will see a chart on the sheet.
- You can change the chart title according to your preferences.
STEP 5: Format Axis
- In step 5, we will format the axis of the graph.
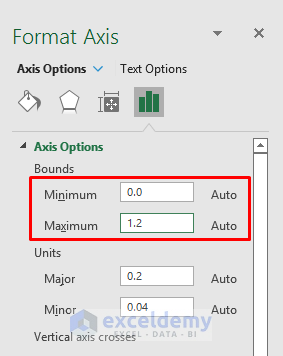
- To do so, double–click on the horizontal axis. It will open the Format Axis options on the right side of the sheet.
- Set the Minimum value to 0 and Maximum value to 1.2 in the Bounds section, and press Enter to proceed.
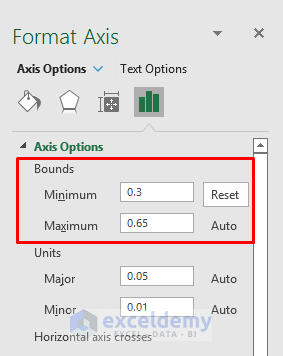
- Similarly, double–click on the vertical axis.
- Then, set the Minimum value to 0.3 and Maximum value to 0.65 in the Bounds section, and press Enter to proceed.
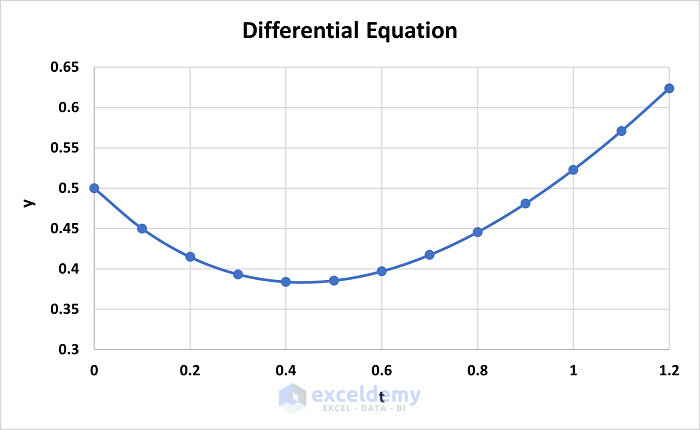
- As a result, the graph will look like the picture below.
Read More: How to Solve an Equation for X When Y is Given in Excel
STEP 6: Find the Exact Solution
- Now, we will calculate the exact solution of the differential equation and match it with the numerical values.
- In our case, the exact solution of the differential equation is y = -1 + t + 1.5*exp(-t).
- So, select Cell E5 and type the formula below:
=-1+C5+1.5*EXP(-C5)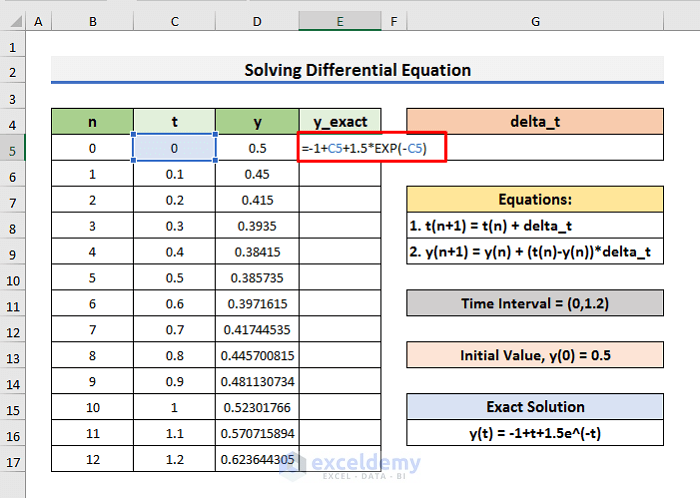
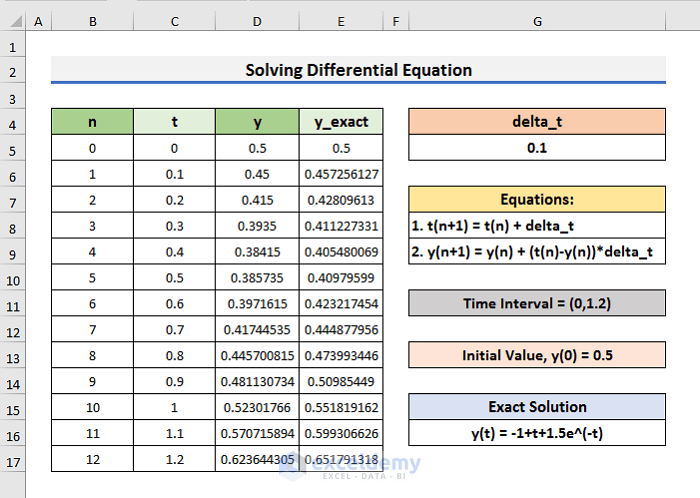
- After that, press Enter and drag the Fill Handle down.
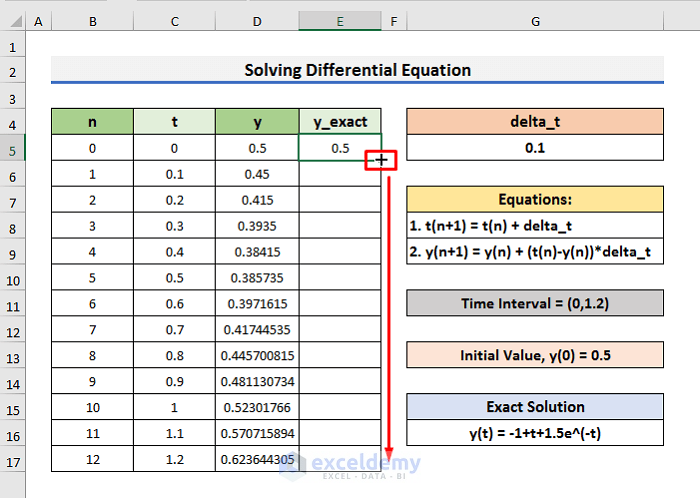
- Finally, you will know the y-values of the exact solution.
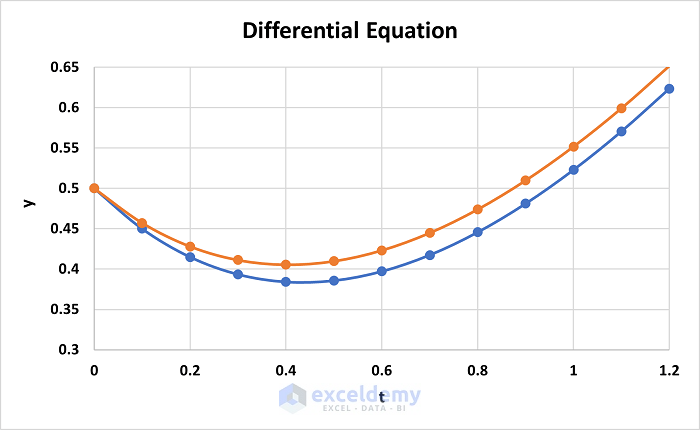
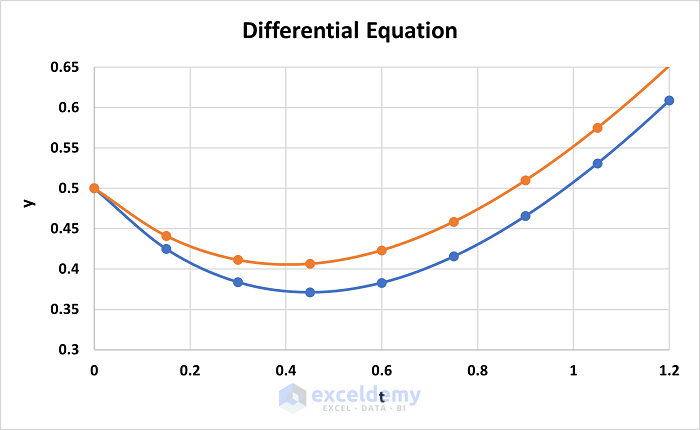
STEP 7: Plot the Exact Solution on the Same Chart
- To compare the y-values of the exact solution with the numerical values, we need to plot them on the same chart.
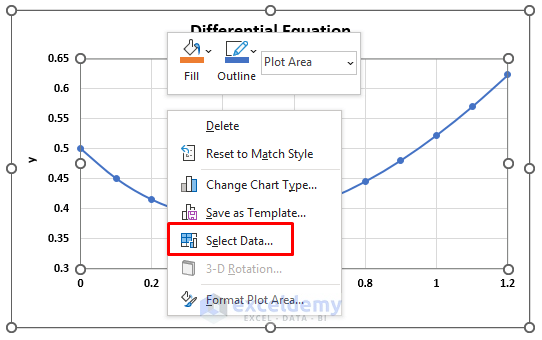
- To do so, right–click on the chart to open the menu.
- Click on the Select Data option.
- In the Select Data Source dialog box, click on Add.
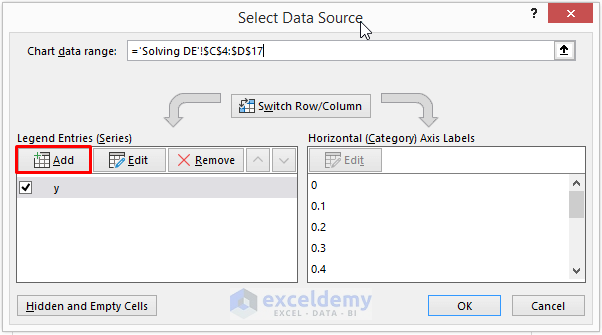
- Now, insert the Series X and Y values in the Edit Series box.

- Finally, click OK to get the plot of the exact solution.
Read More: How to Solve 2 Equations with 2 Unknowns in Excel
Final Output
- Finally, if we change the delta_t value in Cell G5, then the whole dataset will automatically update and show the solution for the updated delta_t value.
- Furthermore, the graphs will also update automatically.
Read More: How to Solve Polynomial Equation in Excel
Download Practice Book
You can download the practice book from here.
Conclusion
In this article, we have discussed step-by-step procedures to solve a differential equation in Excel. I hope this article will help you to perform your tasks efficiently. Furthermore, we have also added the practice book at the beginning of the article. To test your skills, you can download it to exercise. Lastly, if you have any suggestions or queries, feel free to ask in the comment section below.
Related Articles
- How to Solve for x in Excel
- How to Solve Algebraic Equations with Multiple Variables
- How to Solve System of Equations in Excel
- How to Solve Simultaneous Equations in Excel
- How to Solve Nonlinear Equations in Excel
- How to Solve Exponential Equation in Excel
- How to Solve Cubic Equation in Excel
- How to Solve Colebrook Equation in Excel
- How to Solve Quadratic Equation in Excel VBA
<< Go Back to Excel Solve Equation | Excel Solver Examples | Solver in Excel | Learn Excel
Get FREE Advanced Excel Exercises with Solutions!
