
Image by Editor
Data.gov is a powerhouse of datasets from the U.S. government. It offers a vast collection of open datasets across multiple categories, such as health, crime, transportation, climate, business, census, etc. Many of these datasets are available in Excel-compatible formats (CSV, XLSX), making them easy to work with. In this article, we will list 10 interesting sample datasets for Excel on Data.gov.
Download and Use Data.gov Datasets in Excel
Before diving into specific datasets, let’s cover the basics:
- Go to the Data.gov website.
- Use the search bar to search your topic like health, climate, or transportation.

- Download your chosen dataset (usually available in CSV or Excel format).
- Open Excel and import the data:
- To open an Excel file, simply open the downloaded file.
- To open CSV files:
- File >> Open >> Browse >> select your file.

Imported File:
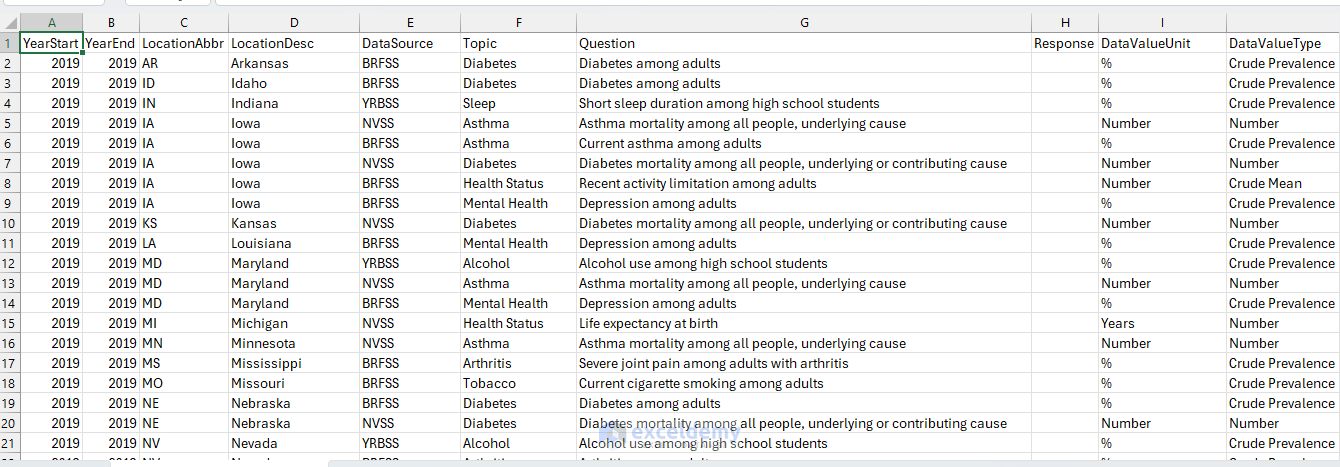
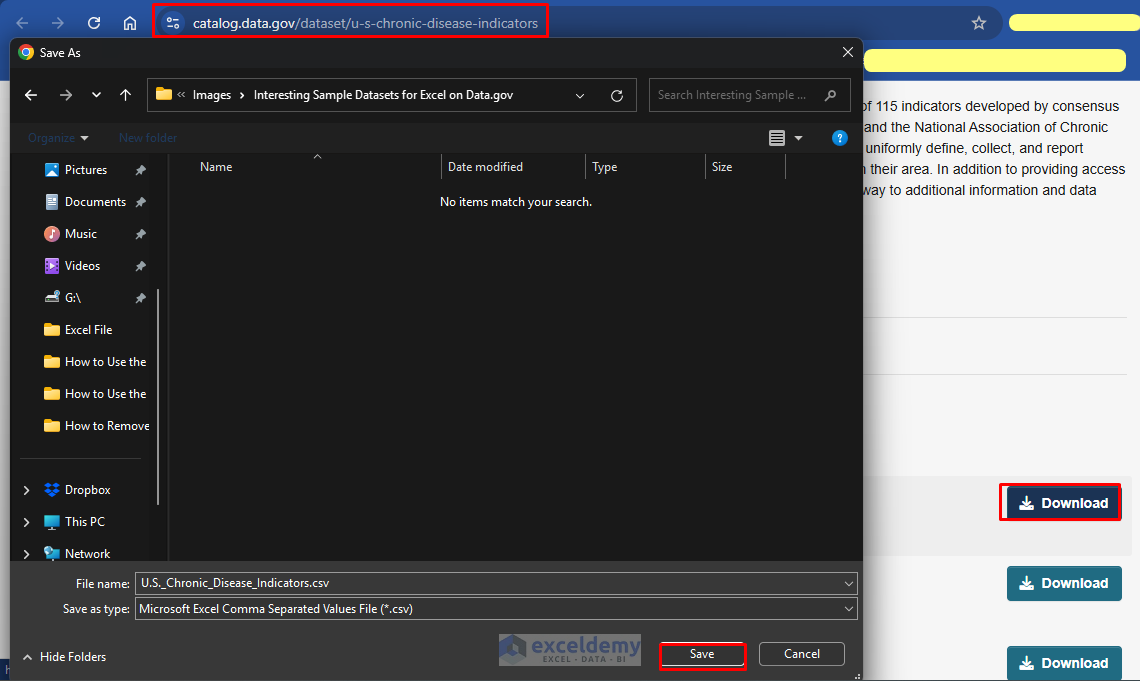
Dataset 1: U.S. Chronic Disease Indicators
- Source: Centers for Disease Control and Prevention (CDC)
- Format: CSV
- Description: This dataset includes key indicators for chronic diseases like diabetes, heart disease, obesity, smoking prevalence, and cancer rates across different U.S. states and territories.
- How to Use in Excel:
- PivotTables: Summarize the data to compare disease prevalence by state.
- Conditional Formatting: Highlight states with high obesity or smoking rates.
- Bar Charts: Visualize chronic disease trends over time.
- VLOOKUP/XLOOKUP: Retrieve disease statistics for specific states.
Dataset Link: U.S. Chronic Disease Indicators
Dataset 2: U.S. Crime Data
- Source: Federal Bureau of Investigation (FBI)
- Format: CSV
- Description: Crime reports across different U.S. cities, including types of crimes like robbery, assault, burglary, and homicide.
- How to Use in Excel:
- COUNTIF: Count crime occurrences in specific cities.
- Bar Charts: Compare crime rates by type.
- Filtering: Focus on a particular year or crime type.
Dataset Link: U.S. Crime Data
Dataset 3: National Student Loan Data System
- Source: U.S. Department of Education
- Format: CSV
- Description: This dataset provides information on student loans, repayment statuses, delinquencies, and loan disbursements across different U.S. institutions.
- How to Use in Excel:
- PivotTables: Analyze loan disbursement trends by year.
- Conditional Formatting: Highlight delinquent loan cases.
- Bar Charts: Compare loan repayment rates across states.
- SUMIFS: Calculate total loan amounts for different school types.
Dataset Link: National Student Loan Data System
Dataset 4: Consumer Complaint Database
- Source: Consumer Financial Protection Bureau
- Format: CSV
- Description: Contains complaints about consumer financial products and services submitted to federal agencies
- How to Use in Excel:
- PivotTable: Analyze complaints by product type and company.
- Filter: Isolate specific financial products or regions.
- Dashboard: Compare resolution rates across companies.
Dataset Link: Consumer Complaint Database
Dataset 5: Public Transportation Data
- Source: U.S. Department of Transportation
- Format: CSV
- Description: The number of people who rode public transportation in Washington State, by Census tract and year (2010 to most recently available ACS data).
- How to Use in Excel:
- Pie Charts: Show ridership distribution by city.
- IF Statements: Classify cities based on transit usage.
- PivotTables: Analyze transit patterns.
Dataset Link: Public Transportation Data
Dataset 6: Climate Change Projections Data
- Source: National Oceanic and Atmospheric Administration (NOAA)
- Format: CSV/XLSX
- Description: Contains historical temperature records, CO₂ levels, and extreme weather events.
- How to Use in Excel:
- Line Charts: Plot temperature trends over time.
- Regression Analysis: Identify long-term climate patterns.
- Histograms: See temperature variations by region.
Dataset Link: Climate Change Projections Data
Dataset 7: Annual Business Survey 2023
- Source: U.S. Census Bureau
- Format: CSV
- Description: This dataset provides data on business demographics, innovation, technology adoption, and R&D activities across U.S. firms. It includes details on small business ownership, minority and women-owned businesses, and industry trends.
- How to Use in Excel:
- PivotTables: Summarize data on minority and women-owned businesses.
- SUMIFS: Calculate total revenue per industry category.
- Scatter Plots: Compare business growth versus employment trends.
- Dashboard: Create interactive visualizations to track business expansion.
Dataset Link: Annual Business Survey 2023
Dataset 8: Farmers Market Directory
- Source: USDA Agricultural Marketing Service
- Format: CSV/XLS
- Description: Contains information on farmers markets across the United States including location, operating times, and available products.
- How to Use in Excel:
- COUNTIFS: Analyze markets by state or product type.
- Pivot Chart: Showcase seasonal availability patterns.
- Text Filters: Find markets with specific offerings.
Dataset Link: Farmers Market Directory
Dataset 9: Most Recent Cohorts Scorecard Elements
- Source: U.S. Department of Education
- Format: CSV
- Description: This dataset includes postsecondary education institution performance metrics, such as graduation rates, student loan repayment rates, earnings after graduation, and average debt levels for recent student cohorts.
- How to Use in Excel:
- PivotTables: Analyze graduation rates by institution type.
- Conditional Formatting: Highlight institutions with high or low loan repayment rates.
- Bar Charts: Compare student earnings after graduation across different colleges.
- IF Statements: Classify schools based on debt-to-income ratio.
Dataset Link: Most Recent Cohorts Scorecard Elements
Dataset 10: Air Quality Dataset
- Source: Centers for Disease Control and Prevention (CDC)
- Format: CSV
- Description: This dataset provides air quality metrics, including ozone and particulate matter (PM2.5) levels, across different locations in the U.S. It supports environmental and public health research by tracking air pollution trends.
- How to Use in Excel:
- Line Charts: Track changes in air pollution levels over time.
- PivotTables: Summarize air quality measures by state and year.
- Conditional Formatting: Highlight regions with poor air quality.
- Regression Analysis: Identify trends in pollution and its correlation with health outcomes.
Dataset Link: Air Quality Measures
Tips
- Data Cleaning: Clean and transform the dataset. You can use Excel’s Text to Columns, Find and Replace, and Remove Duplicates features.
- Performance: For very large datasets, consider using Power Query to import and transform data before loading it into Excel.
- Visualization: Combine multiple datasets for more powerful insights, such as overlaying demographic data with health outcomes or environmental factors.
- Automation: Create macros to automate repetitive analysis tasks when working with regularly updated datasets.
Conclusion
Researchers, students, and analysts can explore Data.gov’s dataset to provide valuable insight in Excel. You can explore these datasets to study chronic diseases, crime rates, climate change, or employment trends. Excel’s powerful tools can help you analyze and visualize data effectively. These real-world data will help you to build your data analysis skills using Excel.
Get FREE Advanced Excel Exercises with Solutions!
