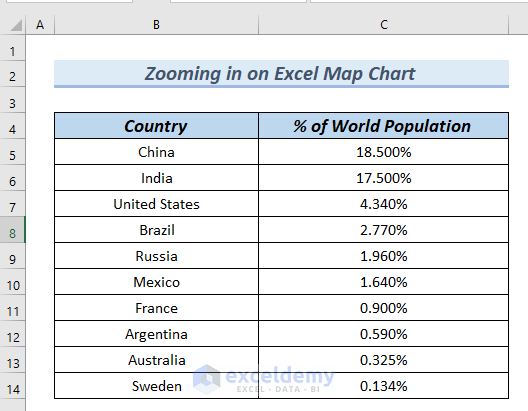
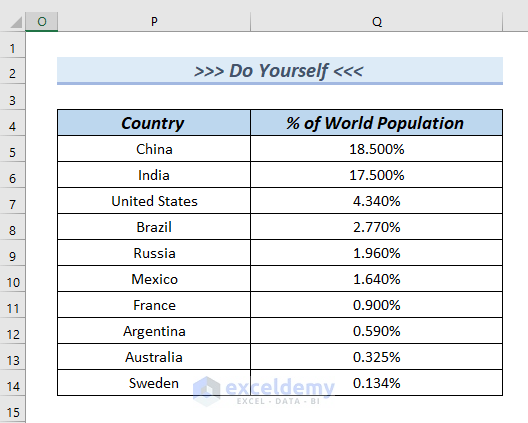
Dataset
Method 1 – Zooming in on a Map Chart in Excel Using Paste Special
In this method, we’ll utilize the Paste Special feature to zoom in on an Excel Map Chart. This approach is effective when you want to focus on a specific region or country within the chart. Let’s walk through the steps:
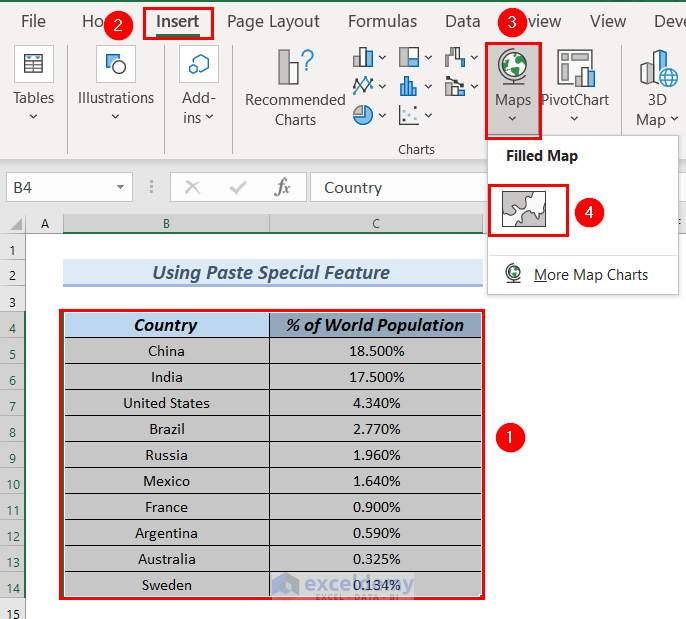
Step 1 – Inserting a Map Chart
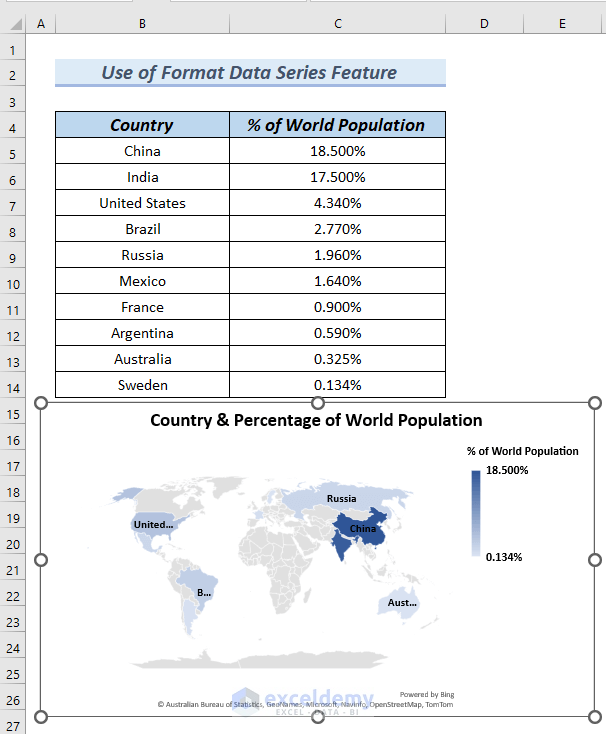
- Select the entire dataset.
- Go to the Insert tab.
- Choose Filled Map from the Maps section.
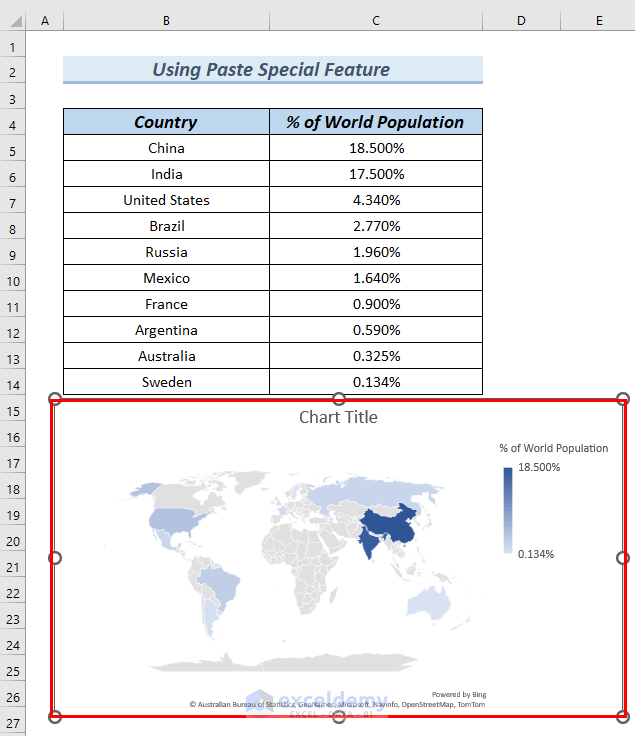
- The Map Chart will appear.
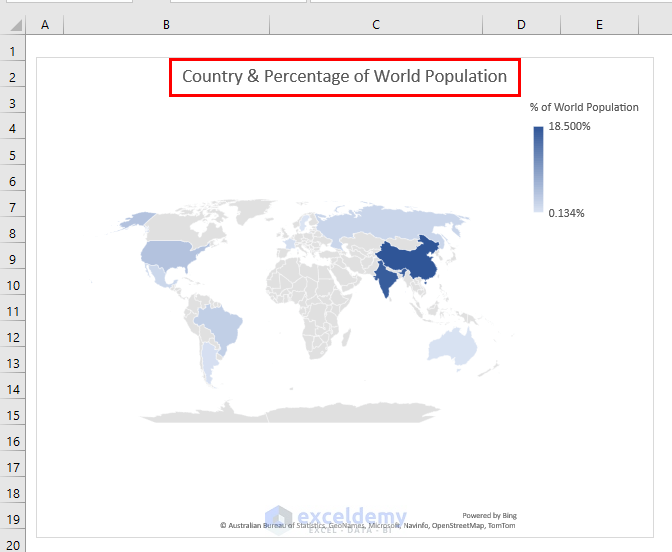
- Edit the chart title (e.g., Country & Percentage of World Population).
- Add country names to the chart:
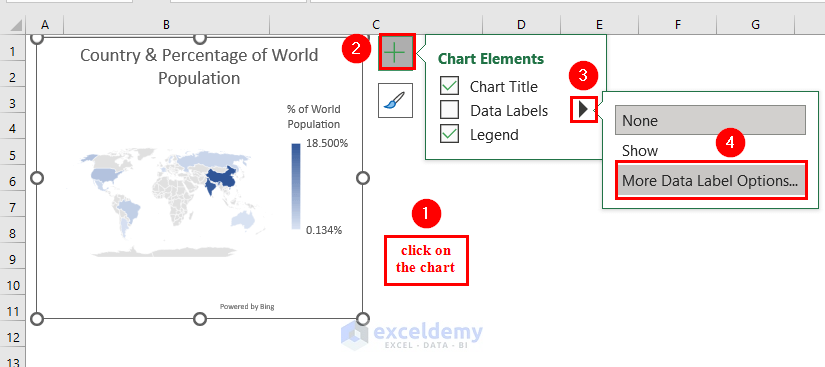
- Click on the chart.
- Access Chart Elements (the plus sign in the top right corner).
- Click the rightward arrow next to Data Labels and select More Data Label Options.
-
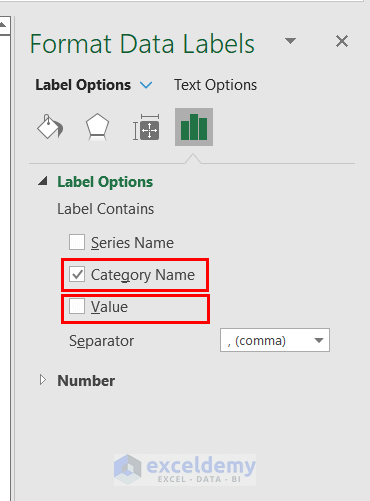
- In the Format Data Labels dialog, check the Category Name box and uncheck the Value box.
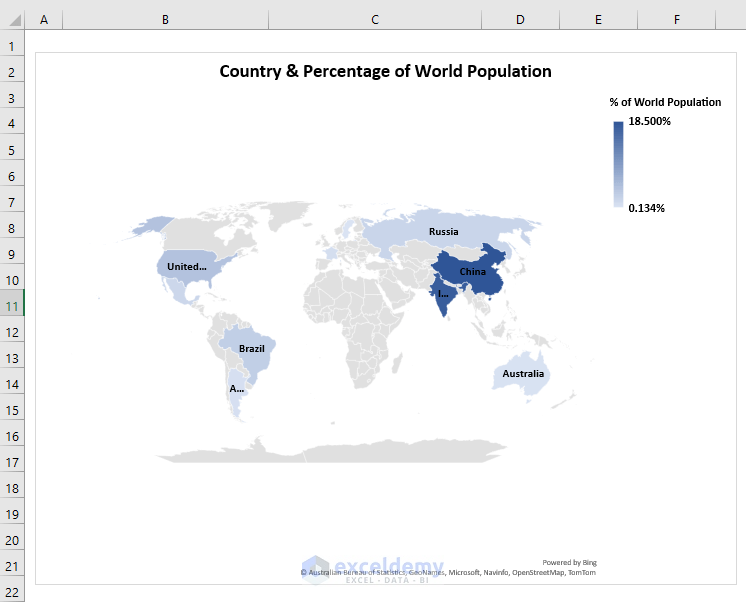
- The Map Chart now displays country names, making it more presentable.
Step 2 – Using Paste Special to Zoom In
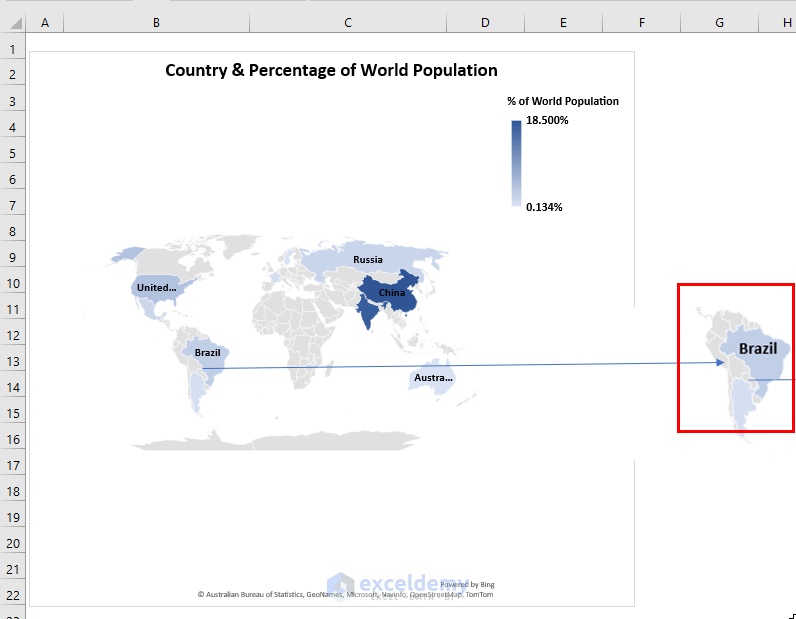
- We’ll zoom in on Brazil as an example.
- Brazil corresponds to cells B13:B16.
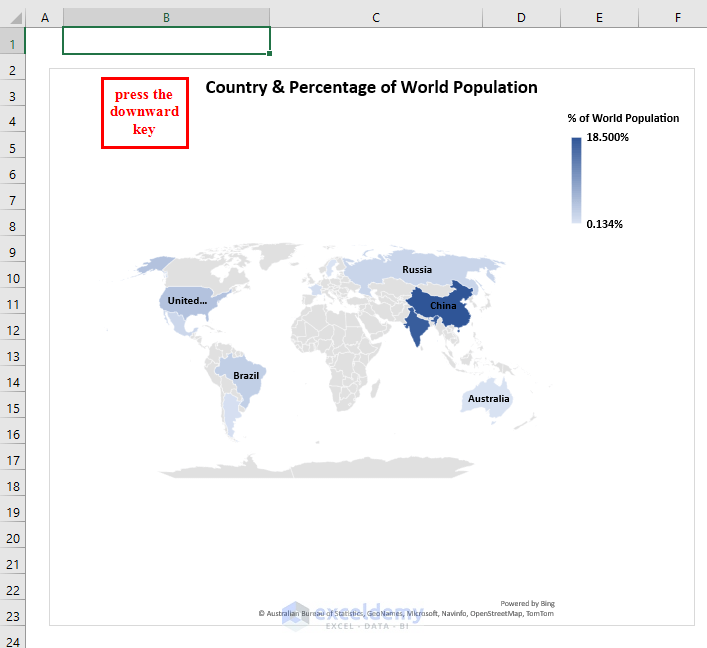
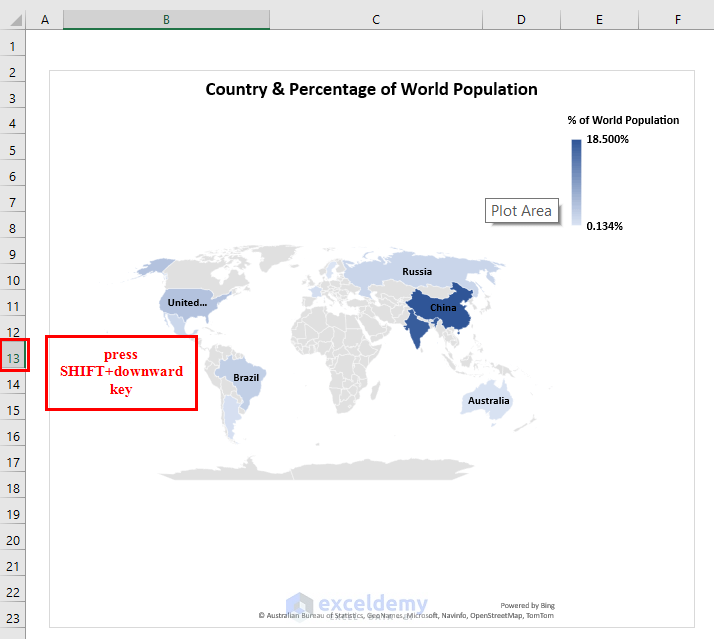
- Start by clicking on cell B1.
- Press the downward arrow key to move down to cell B13.
- Select cells B13:B16 by pressing SHIFT+downward arrow until you reach cell B16.
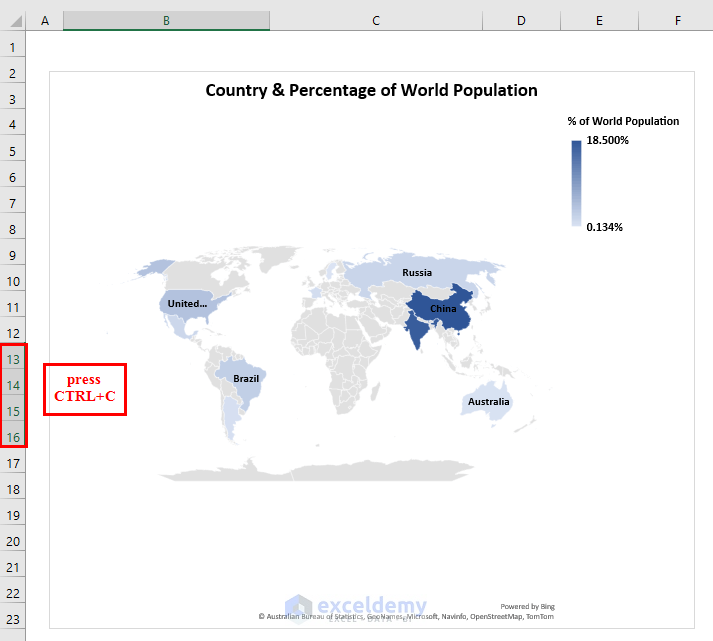
- Copy these cells (CTRL+C).
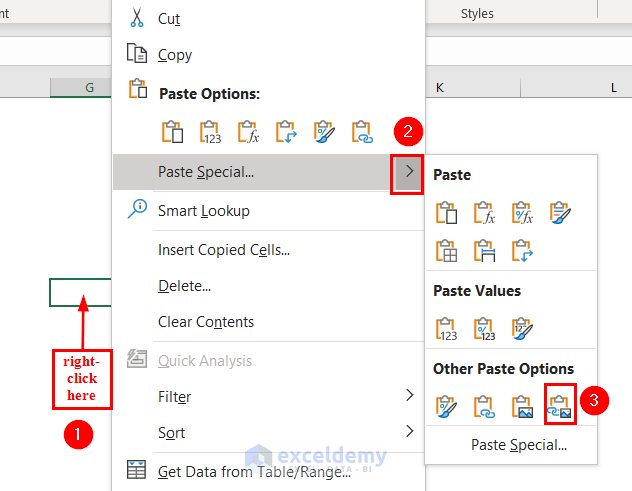
- Right-click on any cell to paste the copied cells.
- From the Context Menu, click the rightward arrow next to Paste Special.
- Choose Linked Picture from the Other Paste Options group.
- You’ll now see a zoomed-in picture of Brazil.
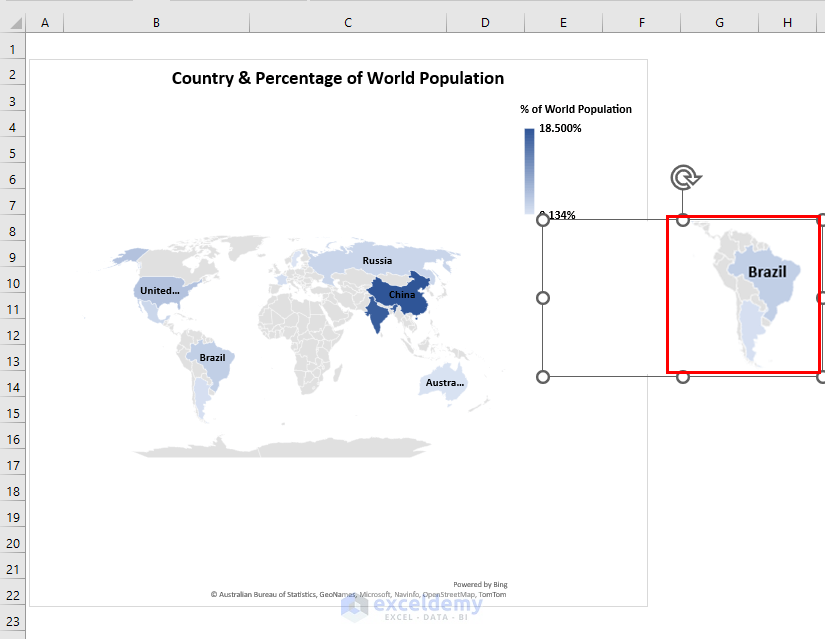
To indicate the link between the zoomed-in view and the Map Chart, insert an arrow line:
- Go to the Insert tab.
- Select an arrow line shape.
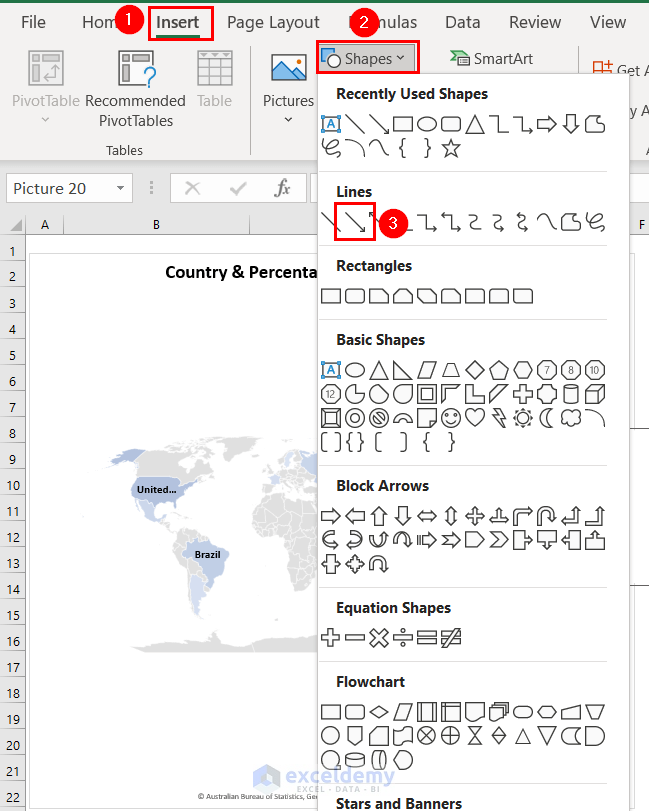
- Draw the arrow line between Brazil on the Map Chart and the zoomed-in Brazil beside the Map Chart.
Method 2 – Using Format Data Series to Zoom In on a Map Chart in Excel
In this method, we’ll utilize the Format Data Series feature to zoom in on an Excel Map Chart. This approach helps remove unnecessary regions from the chart, displaying only the countries or regions included in the dataset. Follow these steps:
- Create the Map Chart:
- Follow Step 1 from Method 1 to create the initial Map Chart.
- Note that the chart currently contains unnecessary regions.
- Zoom In Using Format Data Series:
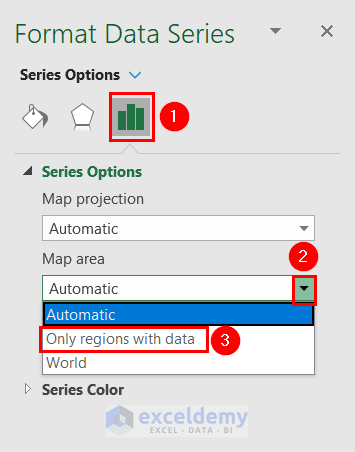
- Right-click on any country (e.g., Australia).
- Select Format Data Series from the Context Menu.
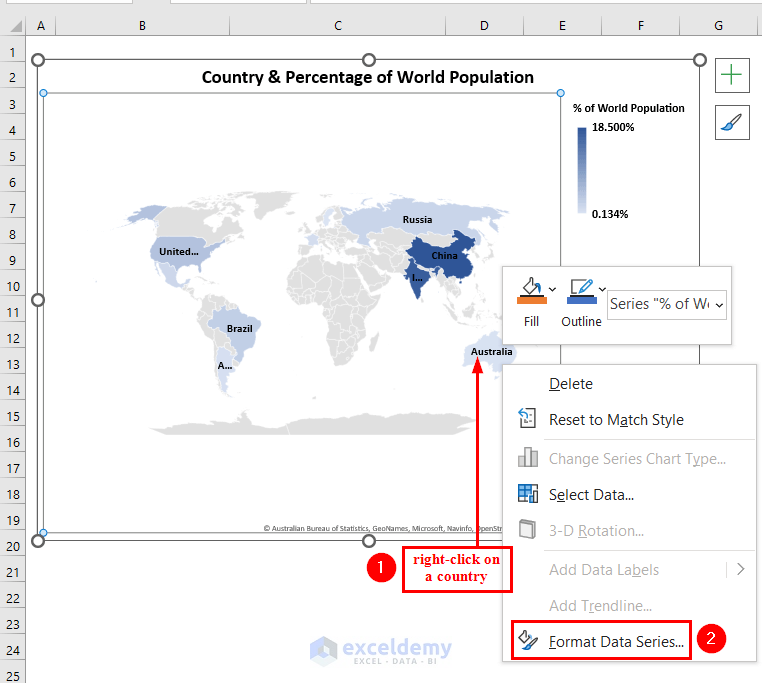
-
- In the Format Data Series dialog, go to the Series Options group.
- Click the downward arrow next to Map area and choose Only regions with data.
-
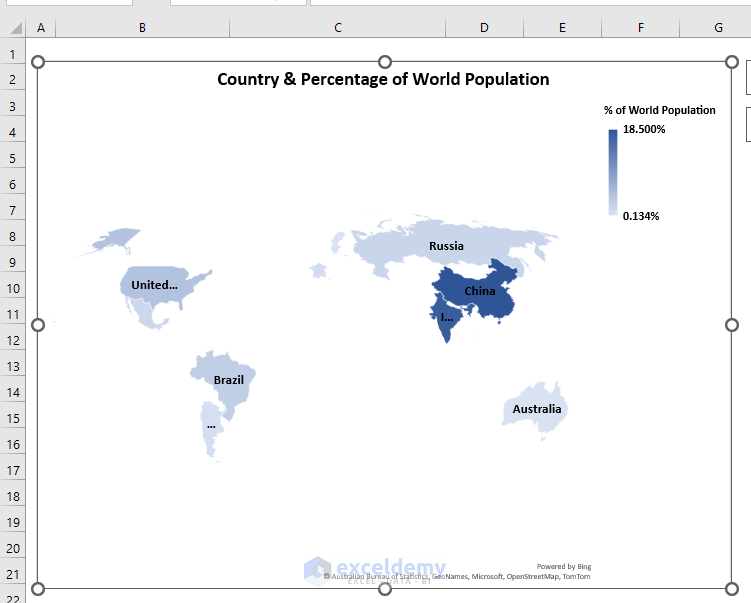
- The map will now display only the countries included in the dataset, resembling a zoomed-in view.
Method 3 – Use of the Mouse Cursor to Zoom in on a Map Chart in Excel
In this method, we’ll enable 3D Maps in Excel and use the Mouse Cursor to zoom in on the Excel Map Chart.
Follow these steps:
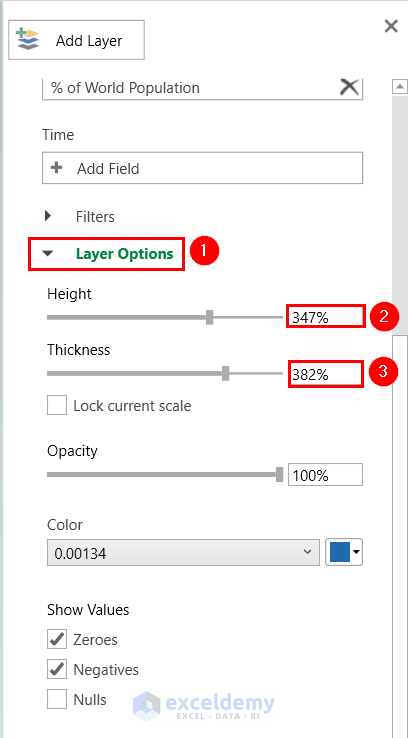
Step 1 – Inserting the 3D Map Chart
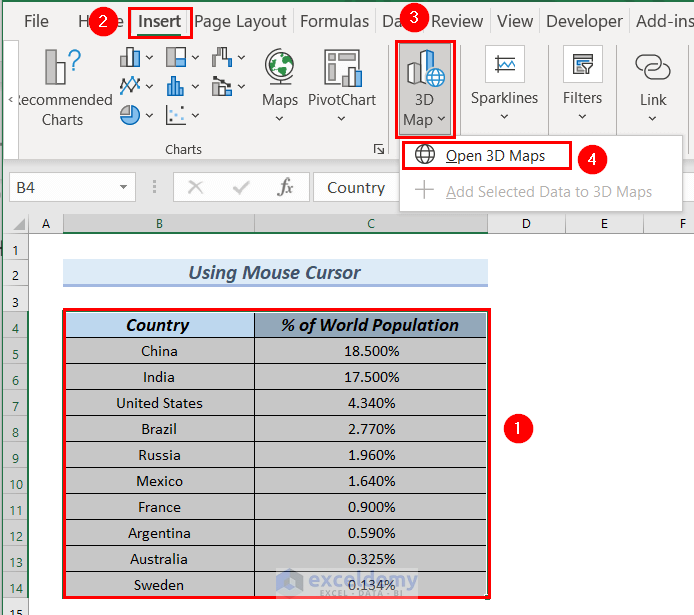
- Select the entire dataset.
- Go to the Insert tab and choose Open 3D Maps from the 3D Map section.
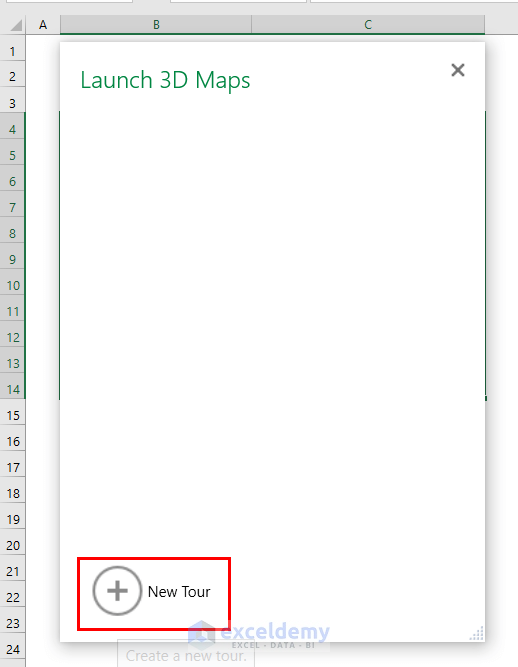
- In the Launch 3D Maps dialog, click New Tour.
- The 3D Map will be created.
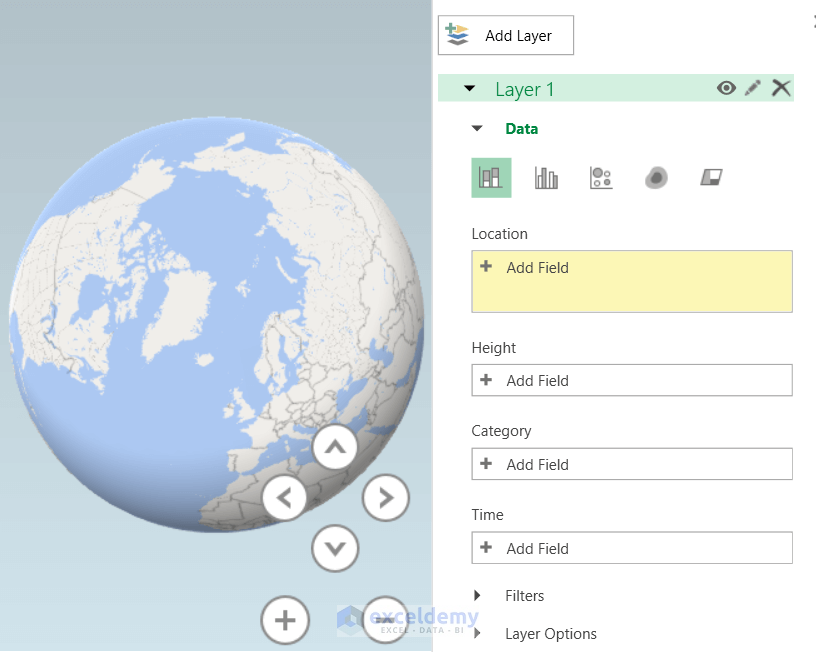
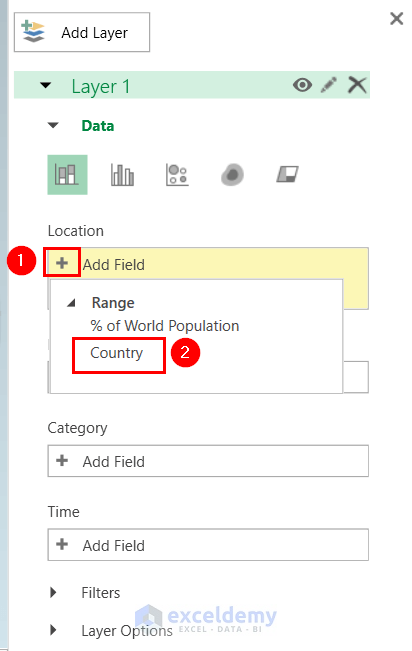
- Add Country to the Location box.
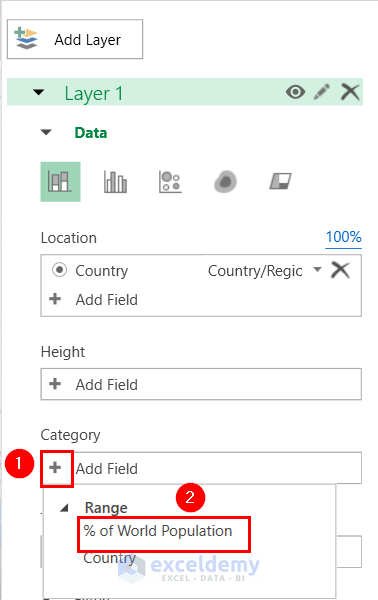
- Add % of World Population to the Category box.
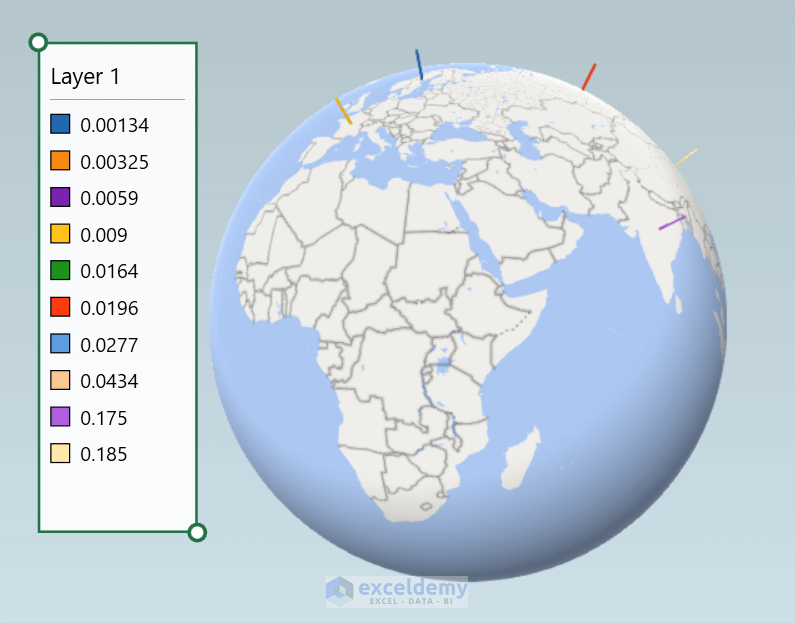
Here, you can see the counties and columns of different colors for the % of World Population.
- Adjust column height and thickness as desired.
Creating a Flat Map:
- Click Flat Map from the Map group.
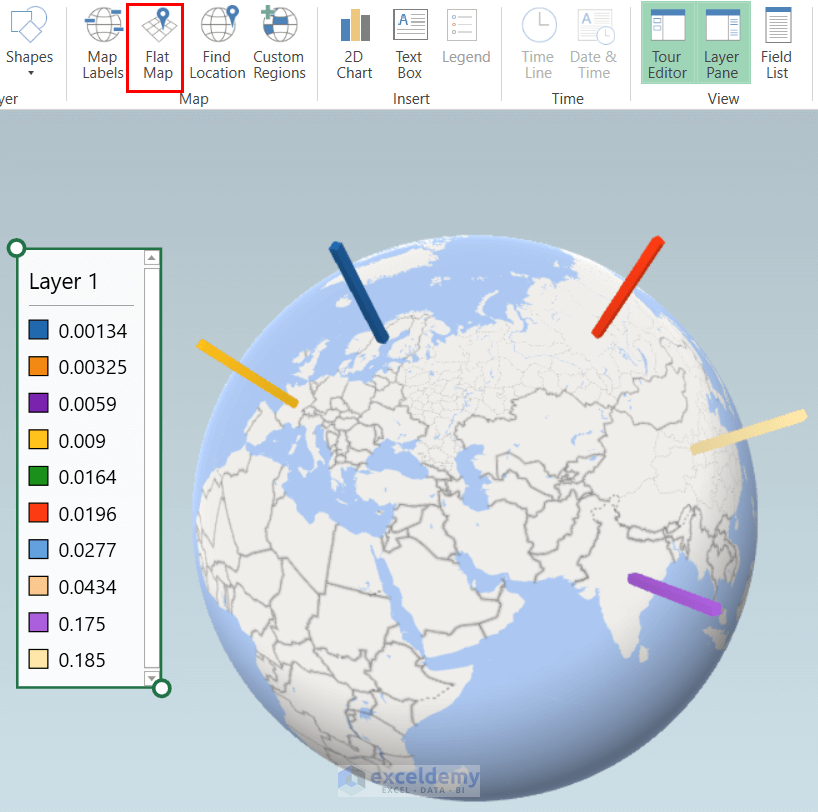
- The Map Chart will appear, but the columns may be less visible.
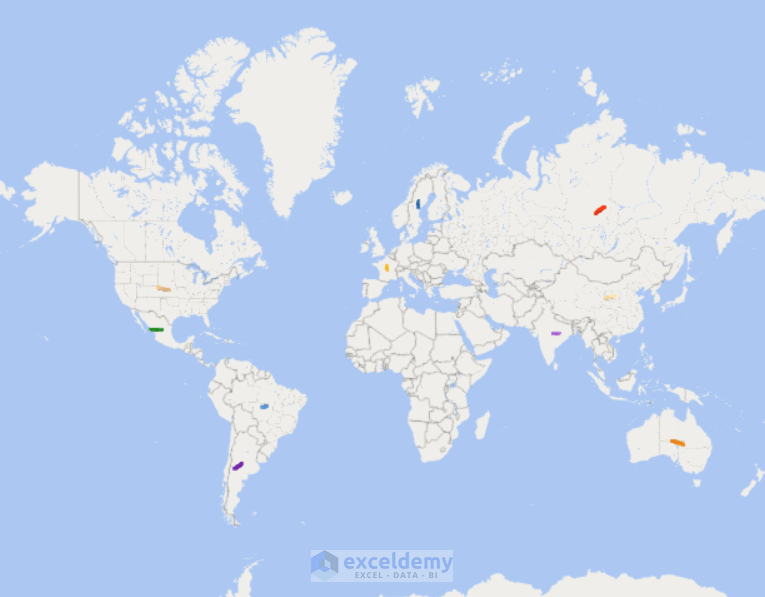
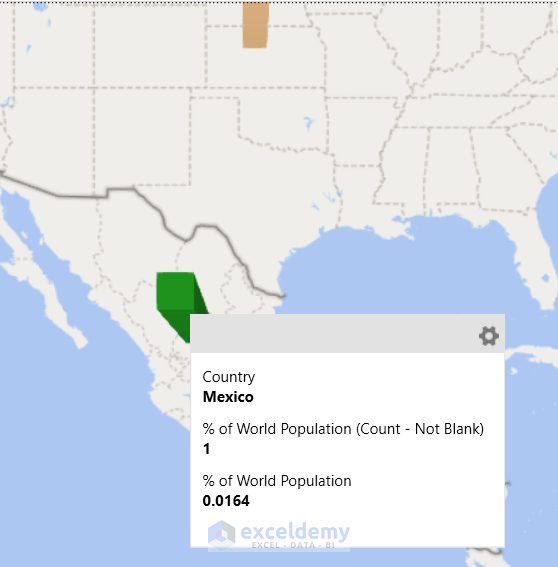
Step 2 – Zoom In Using the Mouse Cursor
- Scroll up with the mouse cursor over the Map Chart.
- When you find the country of Mexico, stop scrolling.

- You’ll see a zoomed-in view of Mexico on the map.
Method 4 – Using Pop-Up Zoom Feature to Zoom In on the Map Chart
In this method, we’ll utilize the zoom feature, represented by a pop-up plus (+) sign on the Map Chart, to zoom in on the Excel Map chart. Follow these steps:
- Create the Map Chart:
- Follow Step 1 from Method 3 to create the initial Map Chart.
- Notice the plus (+) sign in the bottom right corner of the Map Chart.
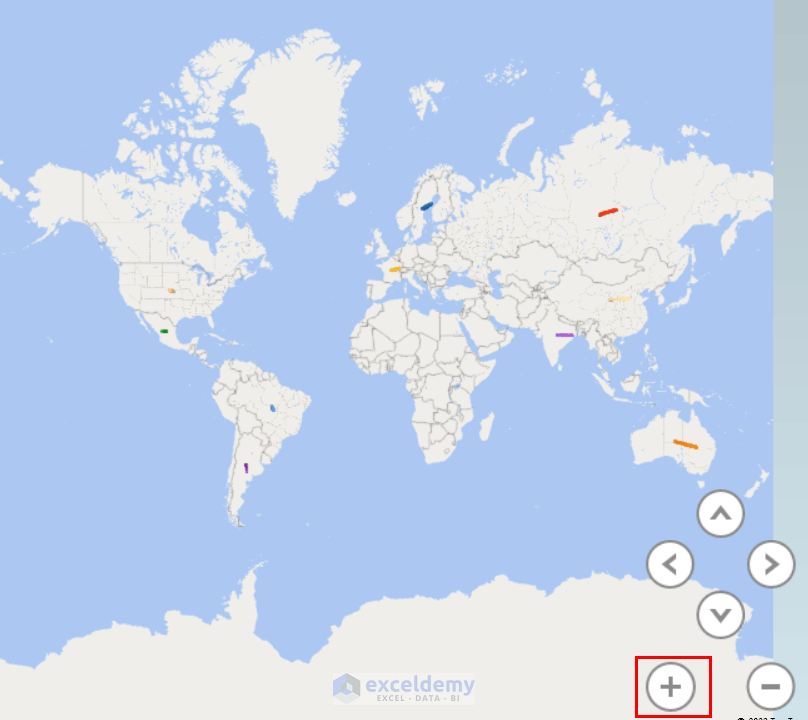
- Zoom In Using the Pop-Up Feature:
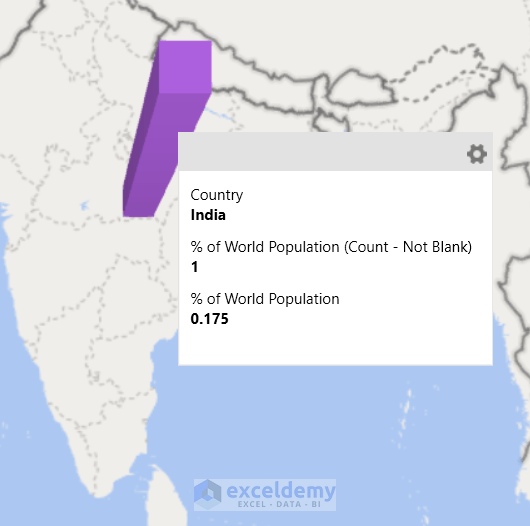
- Click on the plus (+) sign to zoom in.
- Locate the country India on the map.
- You’ll see a zoomed-in view of India.
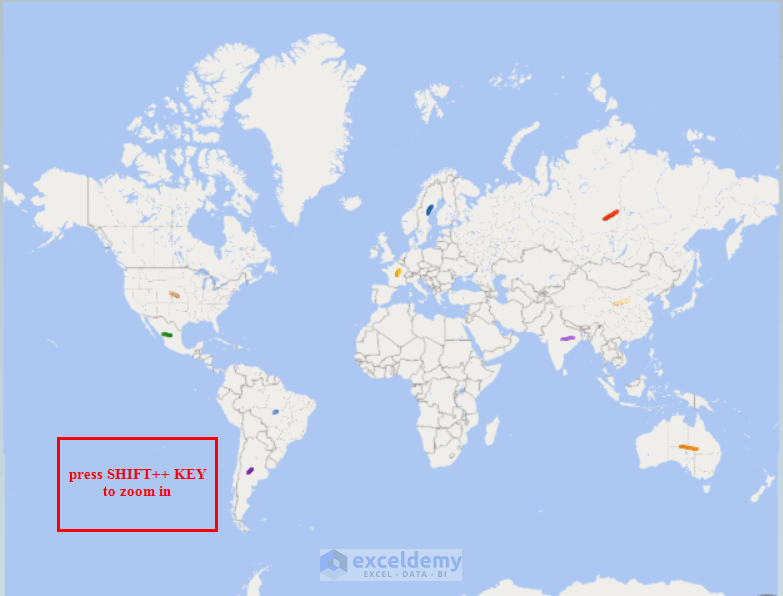
Method 5 – Applying Keyboard Shortcut
In this method, we’ll use a keyboard shortcut to zoom in on the Excel Map Chart. Follow these steps:
- Create the Map Chart:
- Follow Step 1 from Method 3 to create the Map Chart.
- Zoom In Using Keyboard Shortcut:
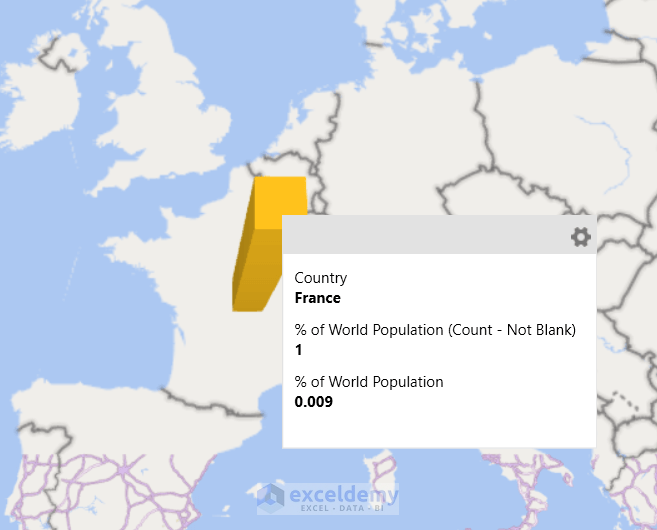
- Press SHIFT++ to zoom in on the Map Chart.
- Keep pressing the + key until you find your desired country (e.g., France).
- You’ll see a zoomed-in view of the selected country.
Practice Section
You can download the above Excel file to practice the explained methods.
Download Practice Workbook
You can download the practice workbook from here:
Related Articles
- How to Zoom Out in Excel
- How to Lock Zoom in Excel
- How to Zoom in Excel Graph
- How to Zoom in When Zoom Slider Is Not Working in Excel
<<Go Back to How to Zoom in Excel | Excel Worksheets | Learn Excel
Get FREE Advanced Excel Exercises with Solutions!
