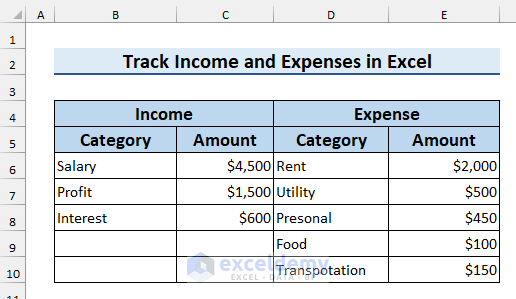
To demonstrate our methods, we’ll use the following sample dataset that contains Income and Expenses in different Categories.
Example 1 – Using Formulas
We can combine the SUMIF and SUM functions to track income and expenses.
Steps:
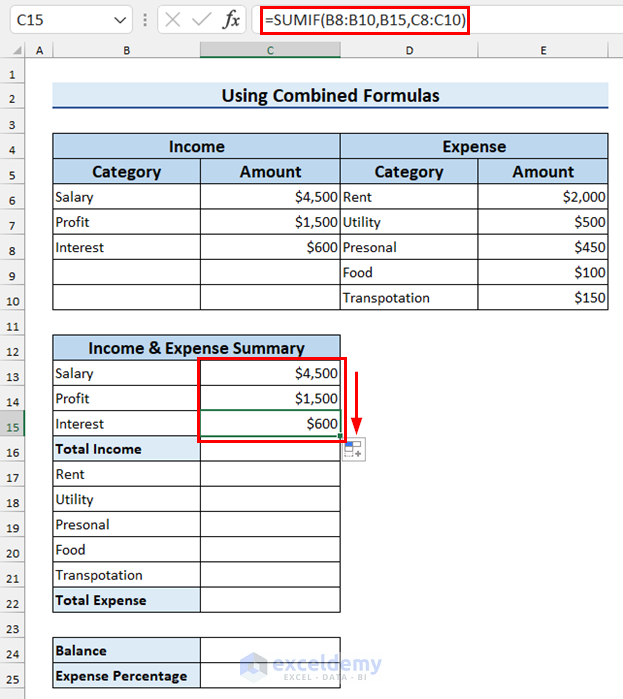
- Select cell C13 (the cell to show the summary of Income).
- Enter the following formula:
=SUMIF(B6:B8,B13,C6:C8)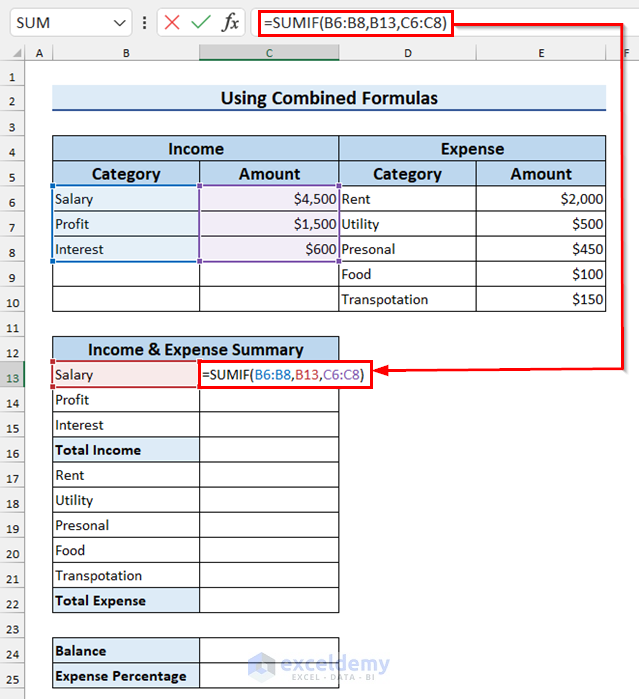
In the function, B6:B8 is the range, B13 is the criteria, and C6:C8 is the sum_range. The function sums the values from sum_range that match the criteria within the selected range.
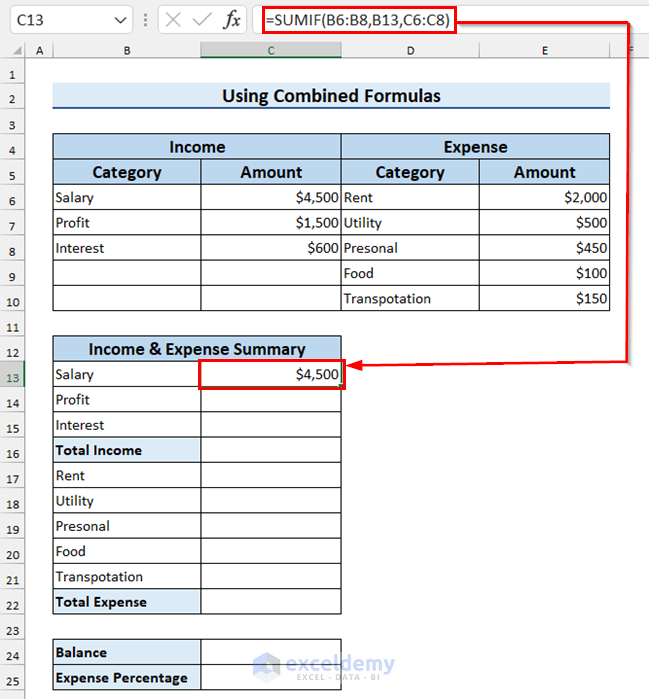
- Press ENTER.
The summed value for that particular Category is returned.
- Drag the Fill Handle to copy the formula to the other cells.
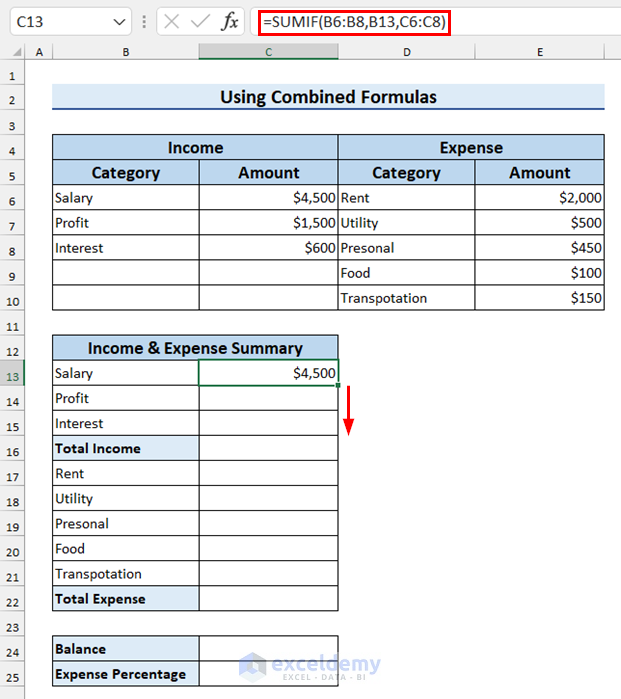
The summed value for all the categories is returned.
- Select cell C16 (the cell to calculate Total Income).
- Enter the following formula:
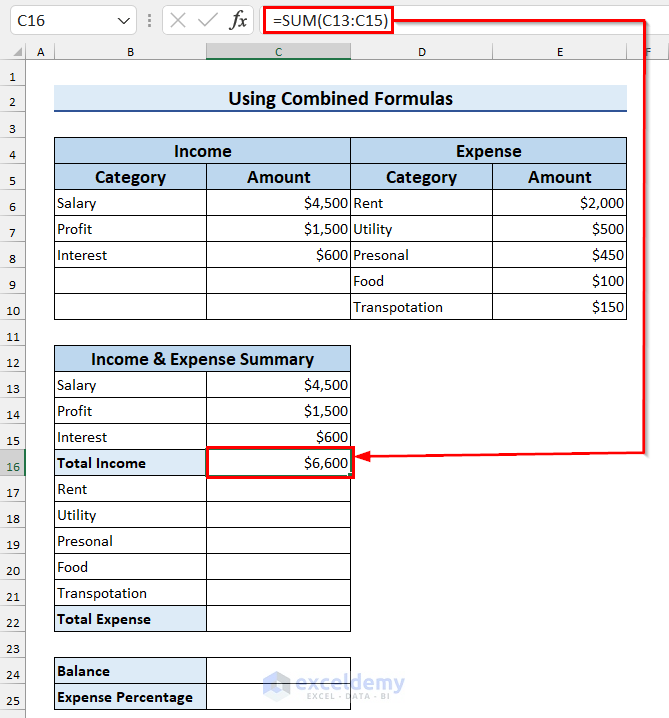
=SUM(C13:C15)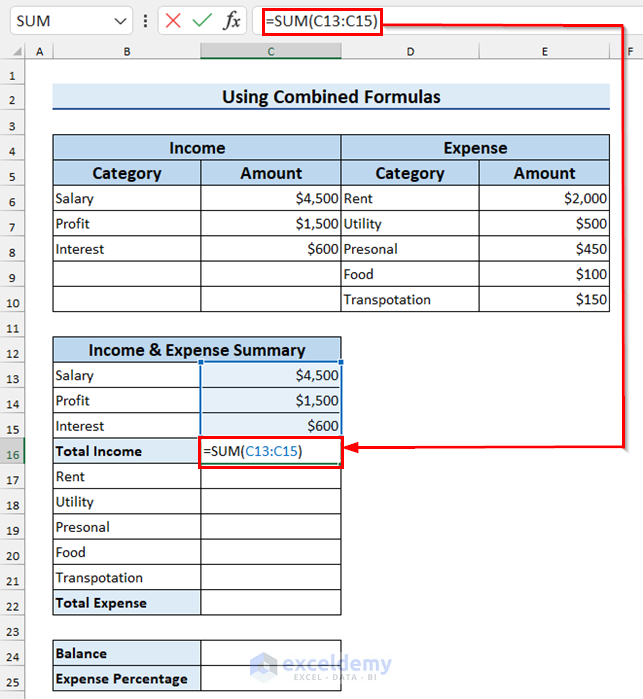
C13:C15 is the number range to sum.
- Press ENTER to return the Total Income.
Follow the exact same process to derive the Expense summary.
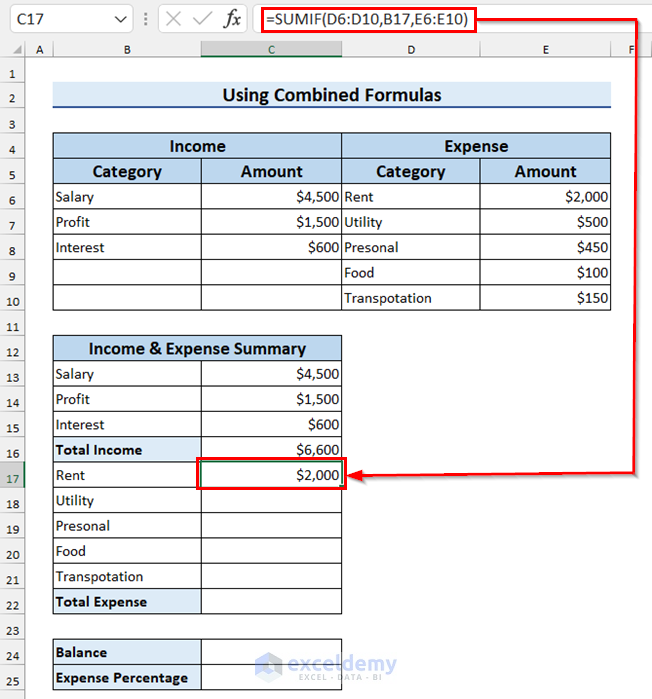
- Select cell C17 (the cell to show the summary of Expense).
- Enter the following formula:
=SUMIF(D6:D10,B17,E6:E10)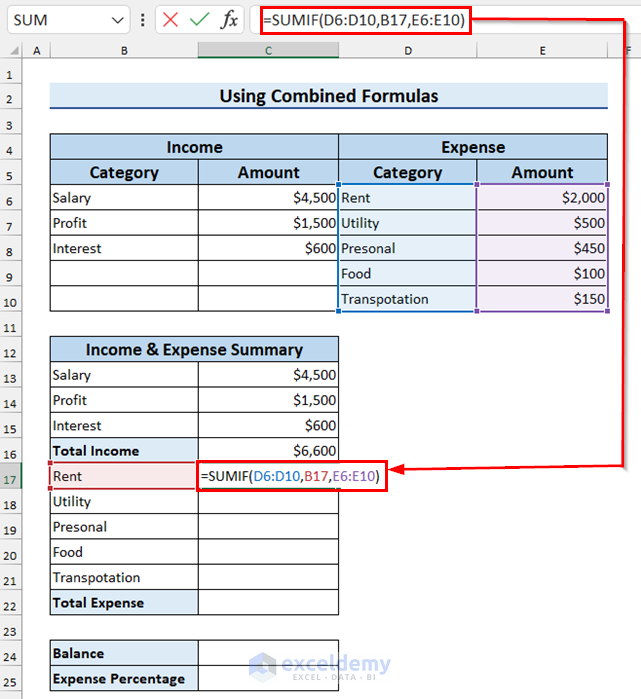
In the function, D6:D10 is the range, B17 is the criteria, and E6:E10 is the sum_range. This function sums the values from sum_range that match the criteria within the selected range.
- Press ENTER to return the summed value for that particular Category.
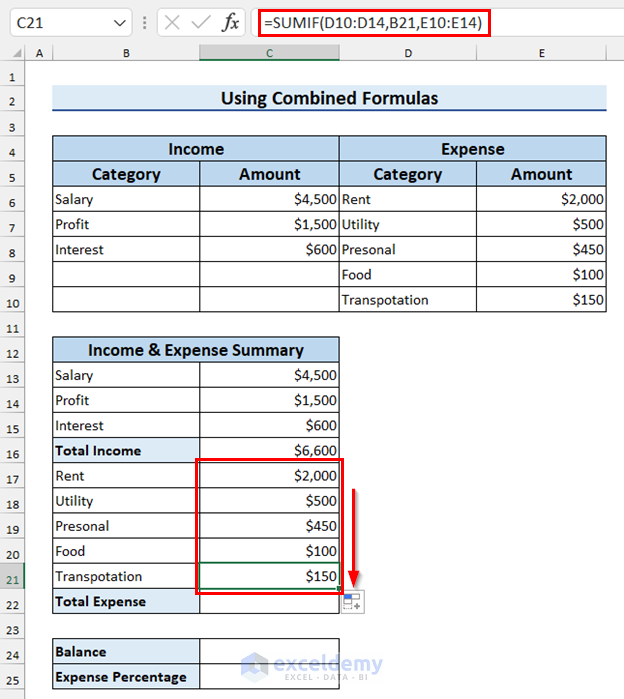
- Drag the Fill Handle down to copy the formula to the other cells.
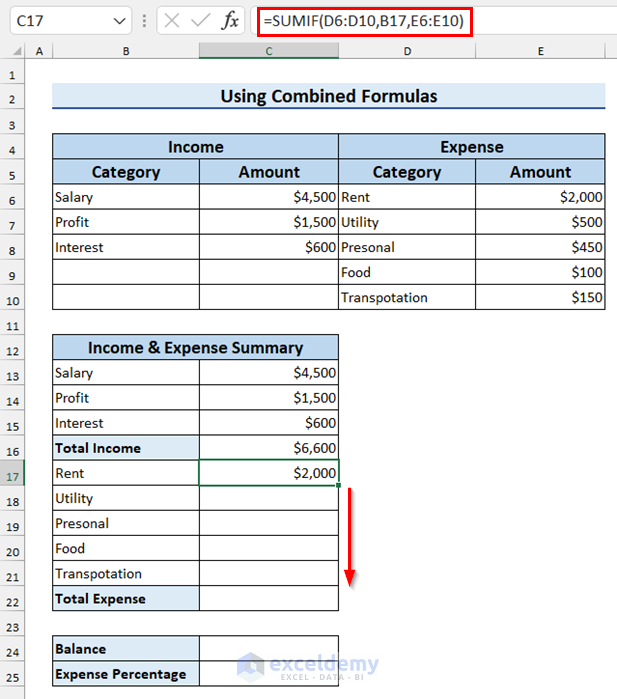
- The summed values for all the categories are returned.
- To calculate Total Expense, select cell C22.
- Enter the following formula:
=SUM(C17:C21)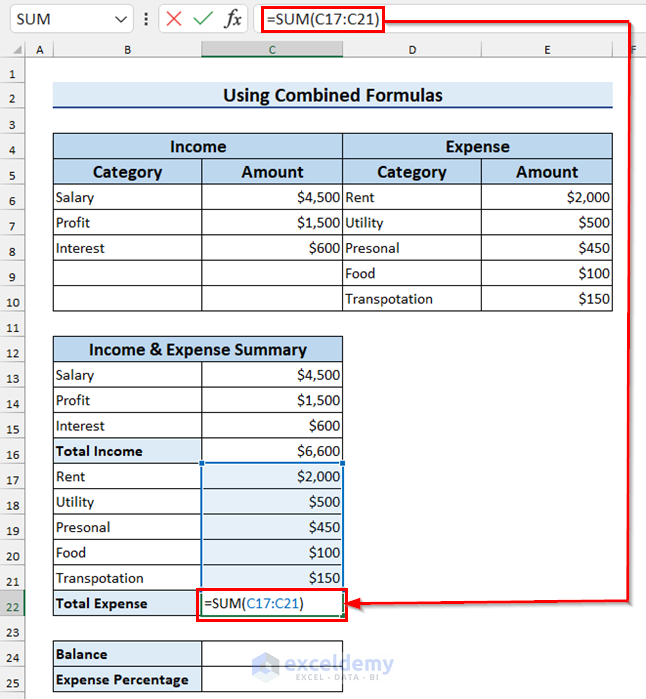
Here, C17:C21 is the number range to sum.
- Press ENTER to return the Total Expense.

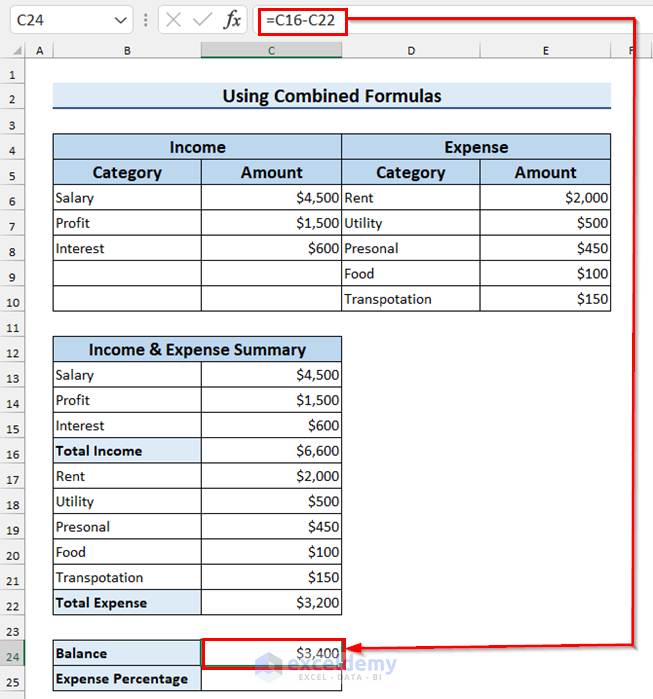
Now we calculate the Balance.
- In cell C24 enter the following formula:
=C16-C22
This formula subtracts Total Expense from Total Income to get the Balance.
- Press ENTER to return the Balance.
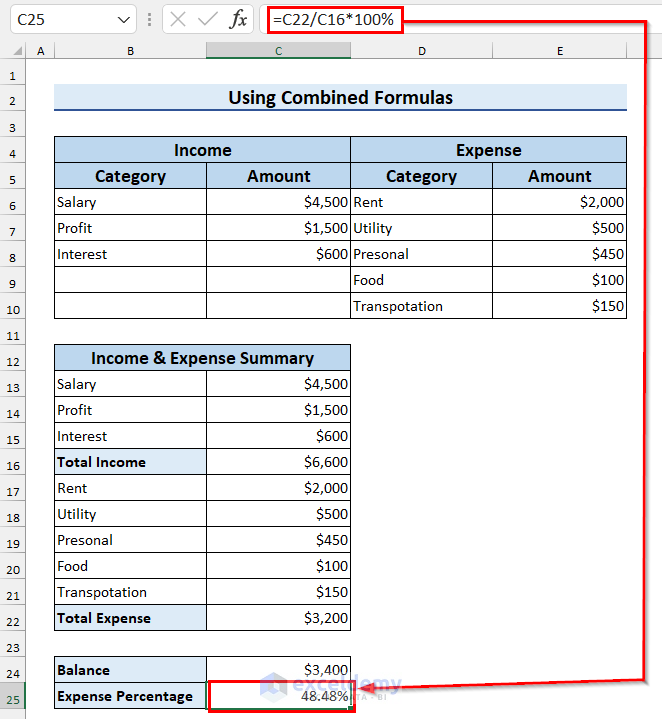
- In cell C25 enter the following formula:
=C22/C16*100%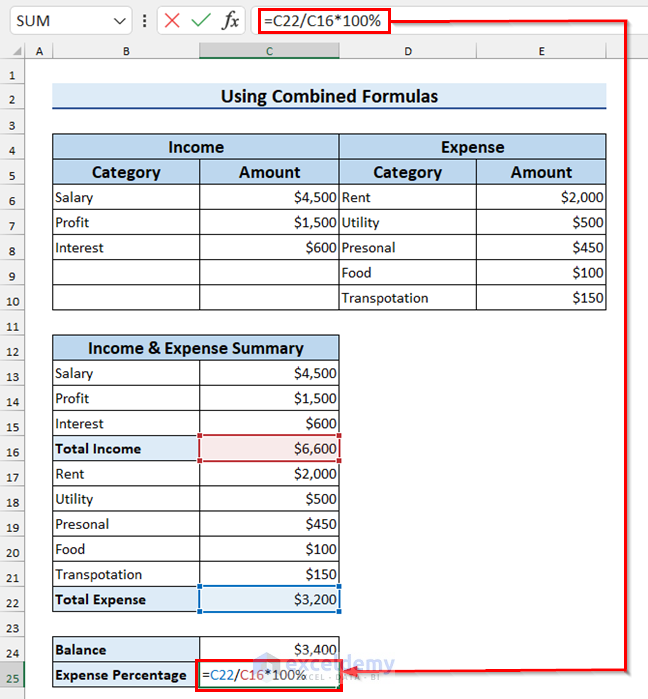
This formula will divide the Total Expense by the Total Income and then multiply it by 100% to return the Expense Percentage.
- Press ENTER.
Example 2 – Using Pivot Table
We can also use the Pivot table to track income and expenses.
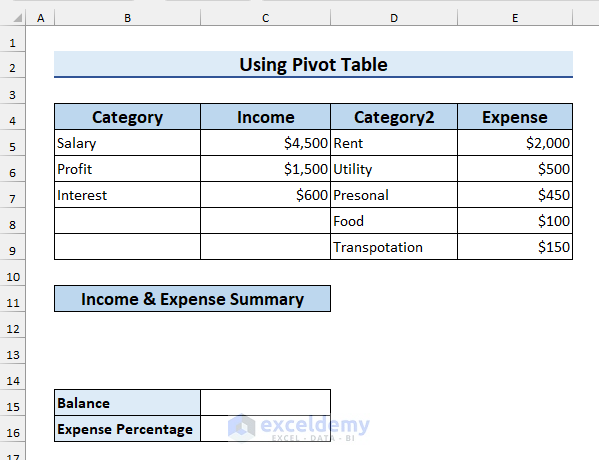
Steps:
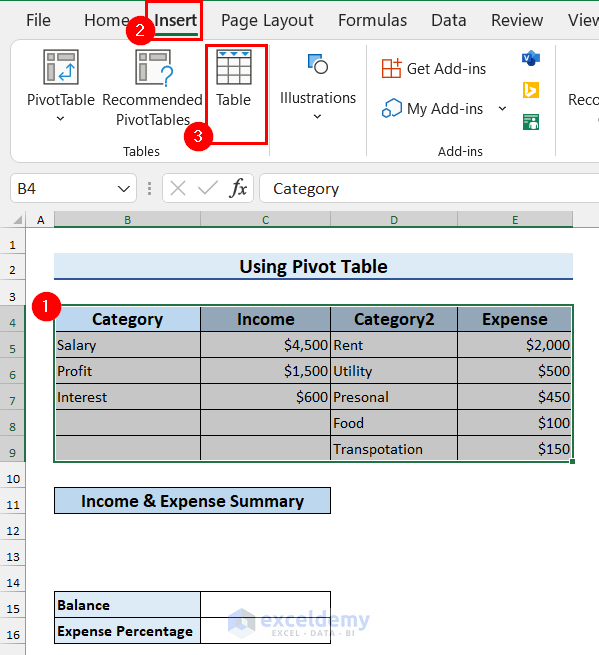
- Select the whole dataset.
- Go to the Insert tab.
- Select Table.
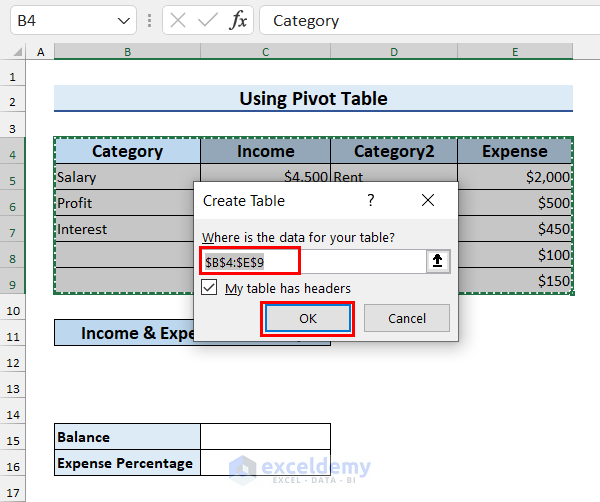
A dialog box will appear on the screen.
- Check if the table selection is correct and adjust if necessary.
- Mark My table has headers.
- Press OK to return the table.
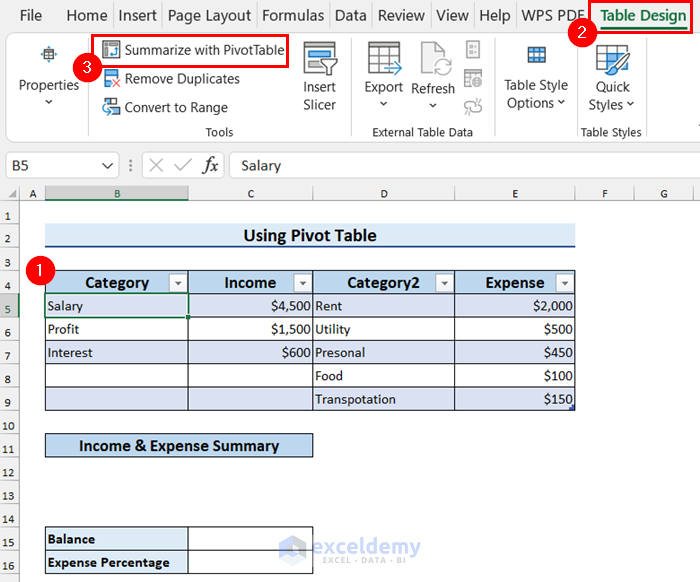
- Select the table again.
- Go to the Table Design tab.
- Select Summarize with PivotTable.
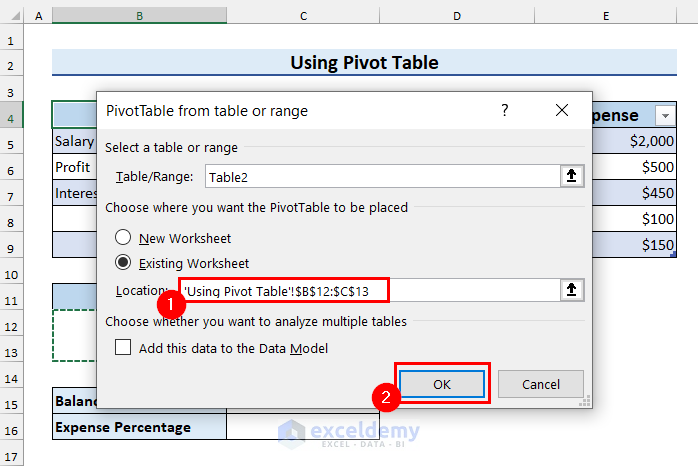
A dialog box will appear on the screen.
- Select the location for the Pivot Table.
- Click OK.
PivotTable Fields list will appear on the right of the screen.
- Select and drag the Income column to the Values area.
The PivotTable will display the sum of values in the Income column.
- Select and drag the Expense column to the Values area.
The PivotTable will display the sum of values in the Expense column.
- Click Update.
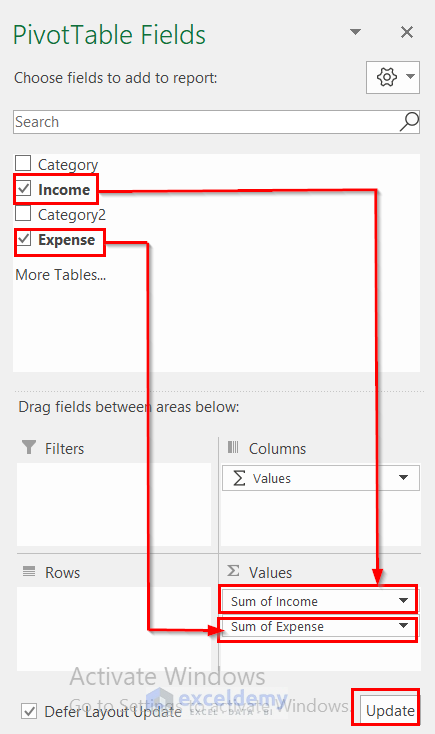
The Sum of Income and Sum of Expense are now displayed.
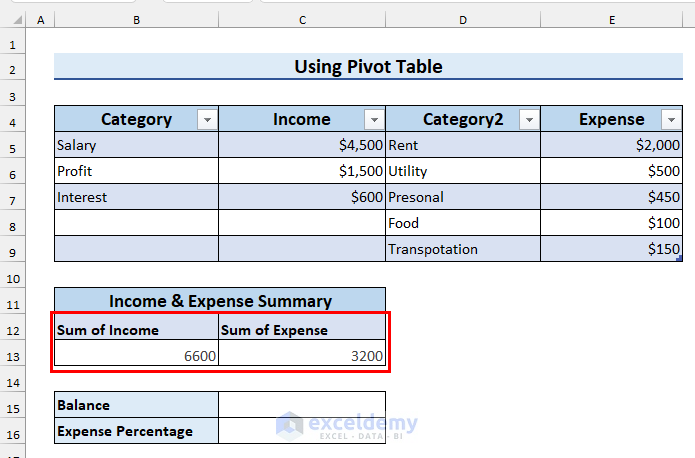
Now we calculate the Balance.
- In cell C15, enter the following formula:
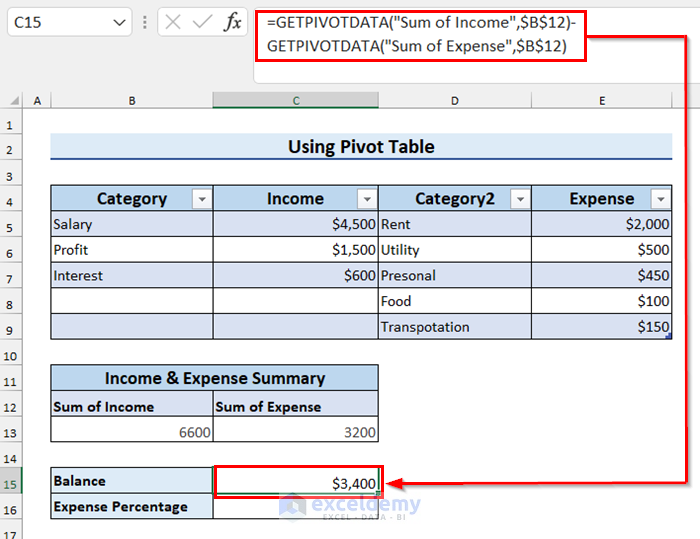
=GETPIVOTDATA("Sum of Income",$B$12)-GETPIVOTDATA("Sum of Expense",$B$12)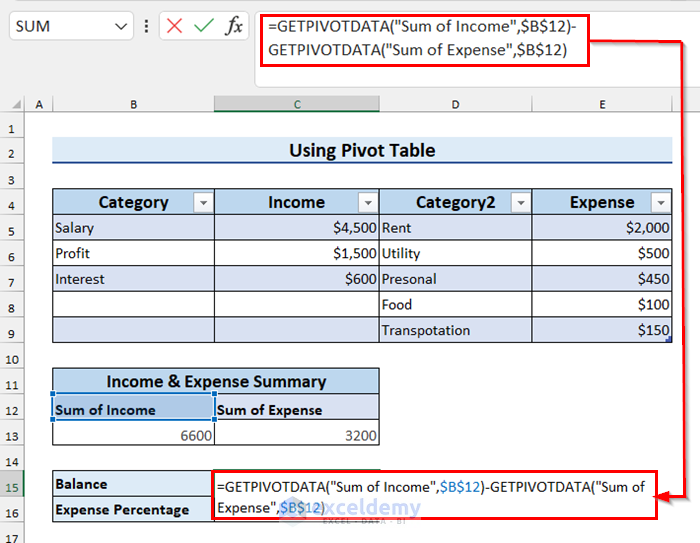
Here, we subtract the Sum of Expense from the Sum of Income to get the Balance.
- Press ENTER to return the Balance.
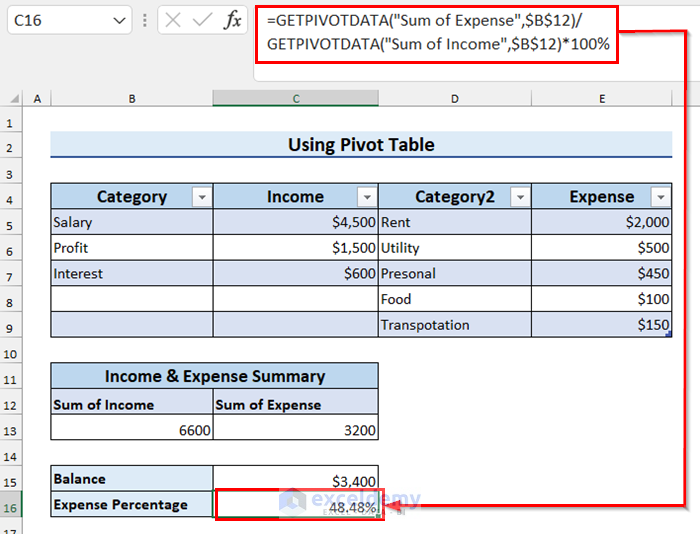
- In cell C16, enter the following formula:
=GETPIVOTDATA("Sum of Expense",$B$12)/GETPIVOTDATA("Sum of Income",$B$12)*100%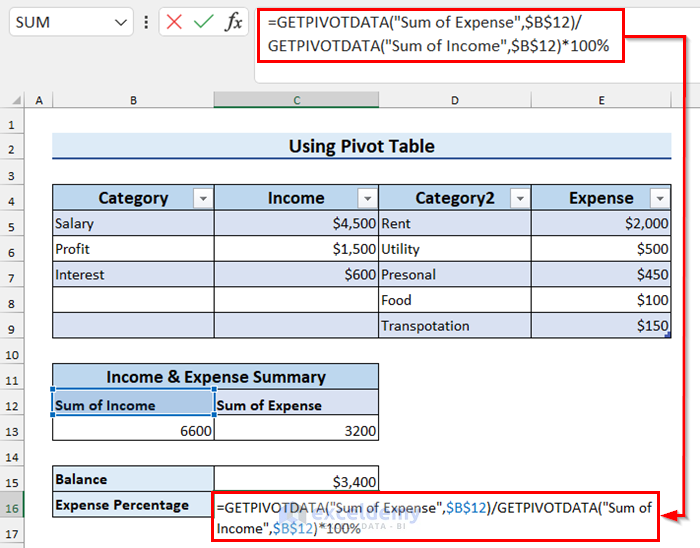
This formula will divide the Sum of Expense by the Sum of Income and then multiply it by 100% to return the Expense Percentage as result.
- Press ENTER to return the Expense Percentage.
Read More: Daily Income and Expense Sheet in Excel
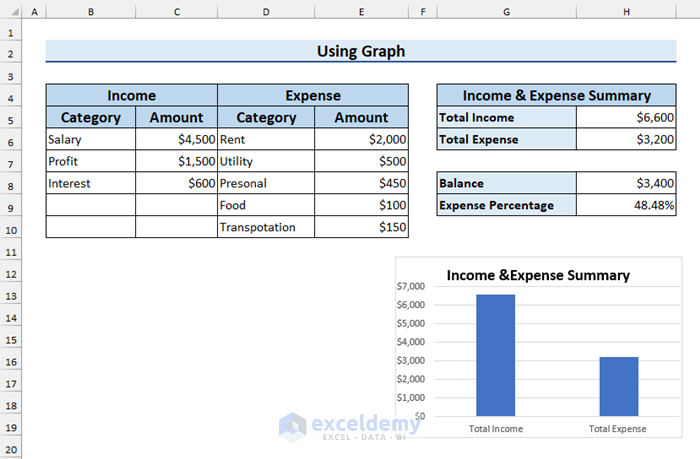
Example 3 – Using a Graph
Steps:
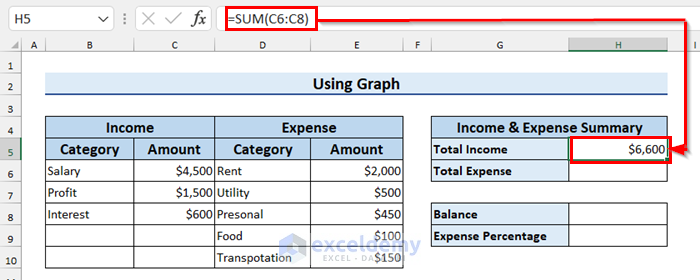
- In cell H5, enter the following formula:
=SUM(C6:C8)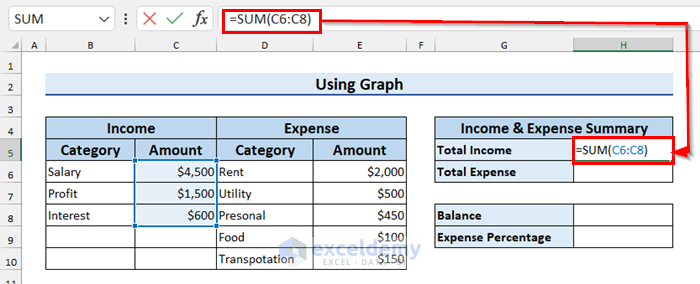
Here, C6:C8 is the number range to be summed.
- Press ENTER to return the Total Income.
Now calculate the Total Expense by following the same steps:
- In cell H6, enter the the following formula:
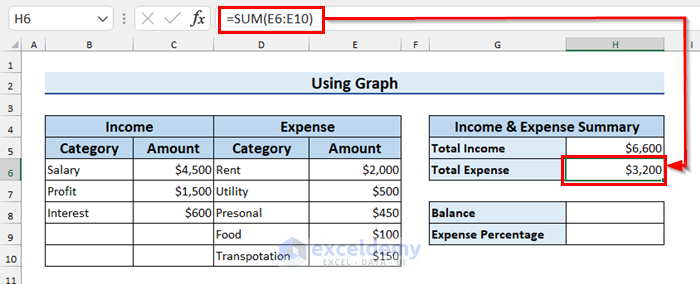
=SUM(E6:E10)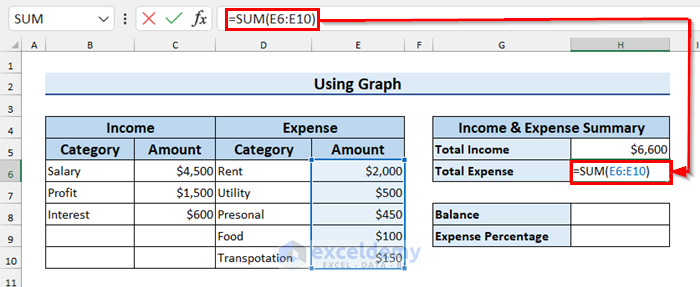
Here, E6:E10 is the number range to be summed.
- Press ENTER to return the Total Expense.
Now, we calculate the Balance.
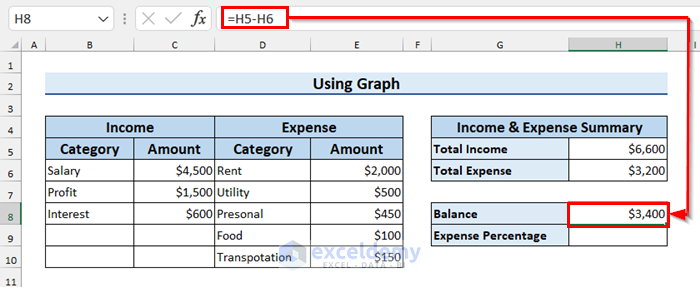
- In cell H8, enter the following formula:
=H5-H6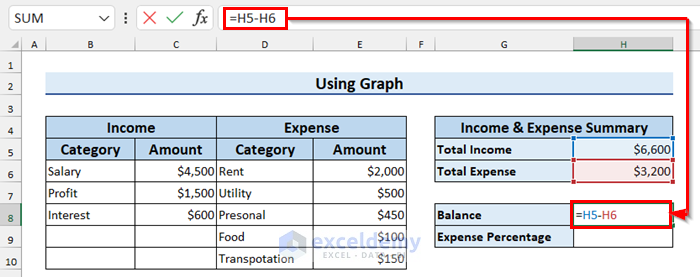
Here, we subtract the Total Expense from the Total Income to get the Balance.
- Press ENTER to return the Balance.
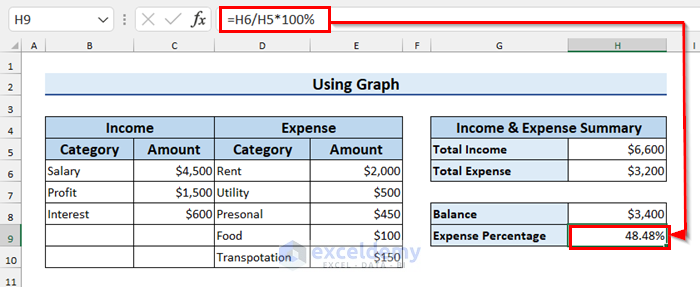
- In cell H9, enter the following formula:
=H6/H5*100%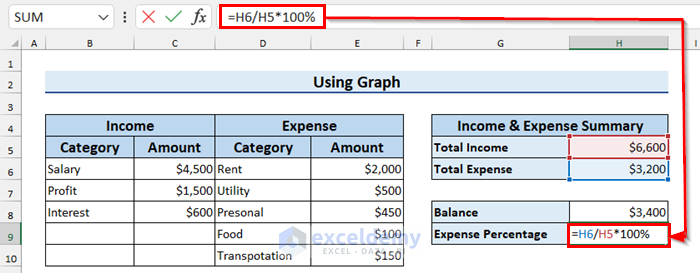
This formula will divide the Total Expense by the Total Income and then multiply it by 100% to return the Expense Percentage as result.
- Press ENTER to return the Expense Percentage.
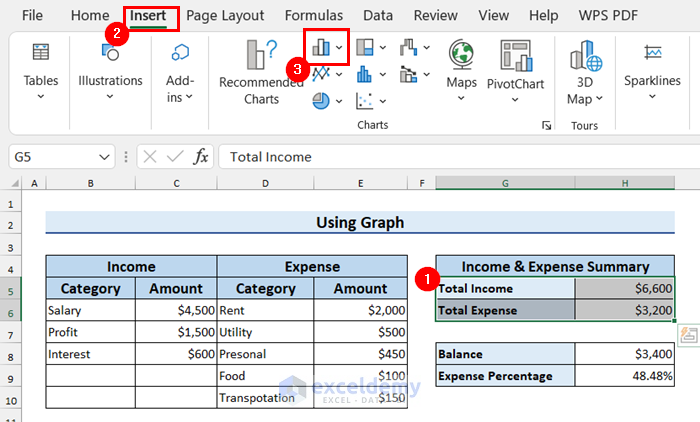
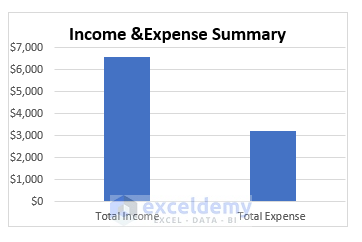
Now we insert a graph for Total Income and Total Expense.
- Select the rows to graph. Here, Total Income and Total Expense.
- Go to the Insert tab.
- Select Column or Bar Chart.
- Select the type of chart. Here, Clustered Column from 2-D Column.
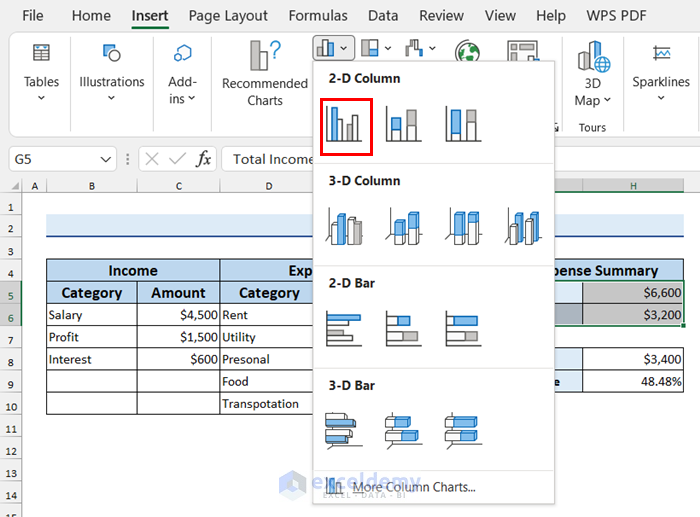
A graph like the image below is created.
Example 4 – Using “Personal Monthly Budget Template”
Excel provides a Personal Monthly Budget template to track income and expenses.
Steps:
- Go to the File tab on the Ribbon.
- Select the Personal Monthly Budget template as follows:
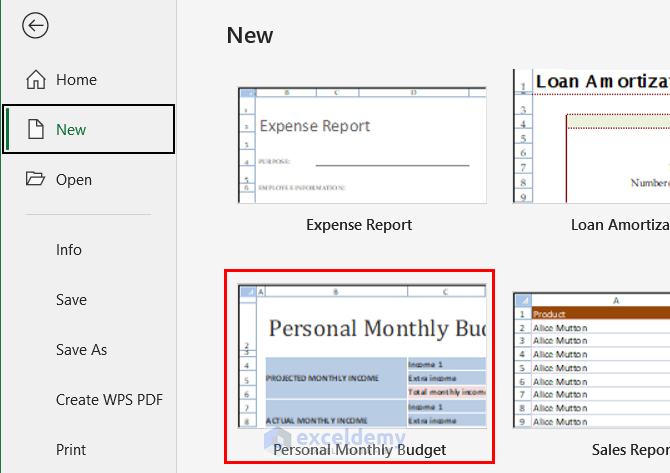
- Select Create.
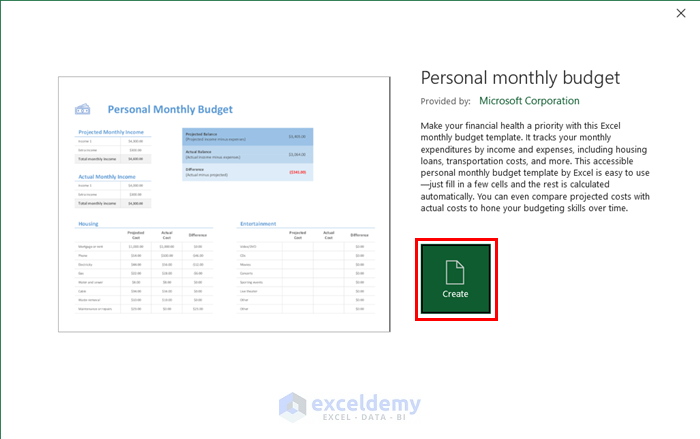
The template will appear.
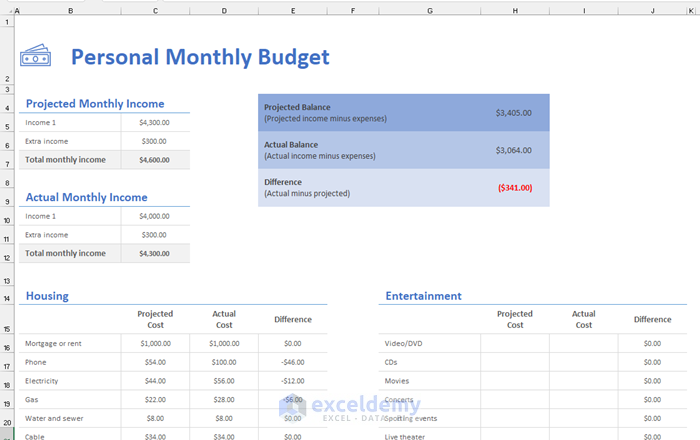
- Edit the template according to your dataset.
This template will automatically calculate Total monthly income and Total Expense. It uses the SUM function to calculate Total monthly income and the SUBTOTAL function to calculate Total Expense.
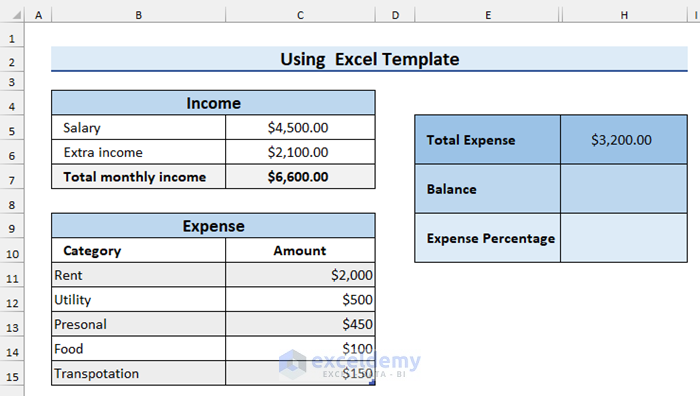
Now, we calculate the Balance.
- Select the cell to store the Balance.
- In that cell, enter the following formula:
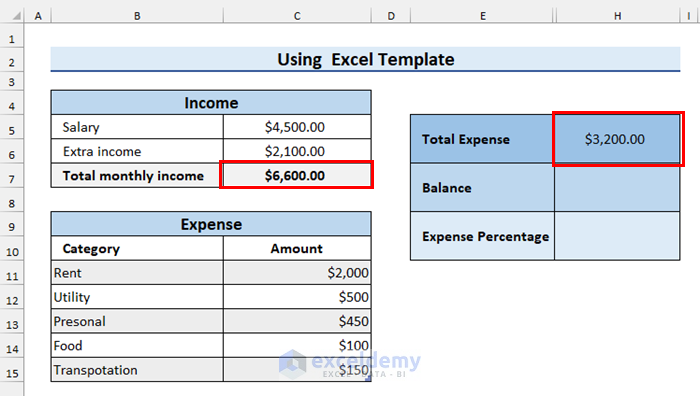
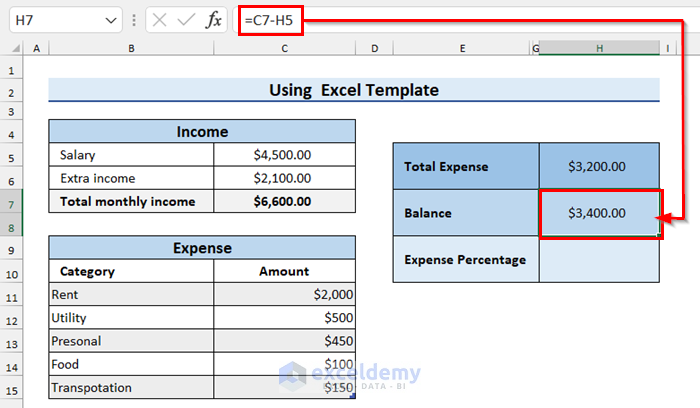
=C7-H5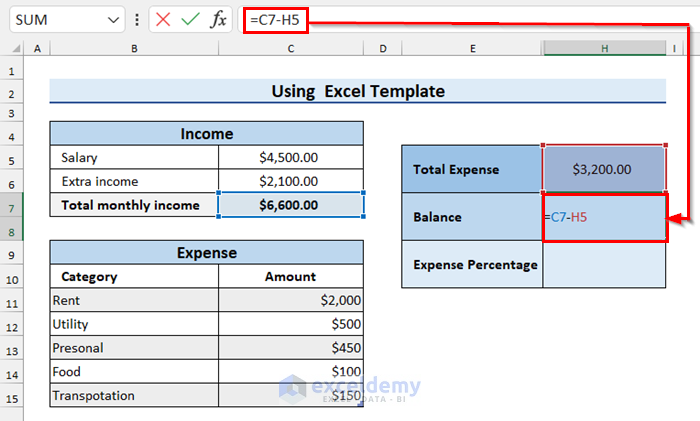
Here, we subtract the Total Expense from the Total monthly income to get the Balance.
- Press ENTER to return the Balance.
- Select the cell to calculate Expense Percentage.
- In that cell, enter the following formula:
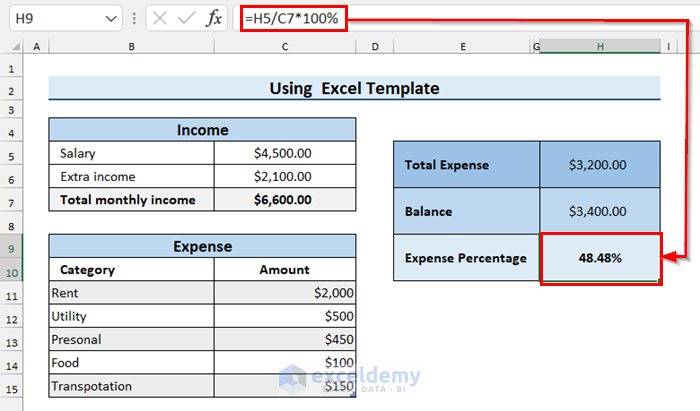
=H5/C7*100%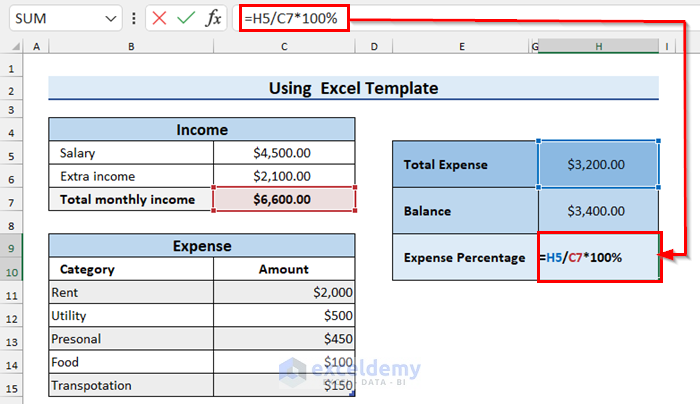
We divide the Total Expense by the Total monthly income and then multiply it by 100% to get the Expense Percentage as result.
- Press ENTER to return the Expense Percentage.
Things to Remember
- When working with PivotTable, the name of every column must be different.
Download Practice Workbook
Related Articles
- How to Calculate Business Income and Expense in Excel Worksheet
- How to Keep Track of Small Business Expenses in Excel
- How to Create Daily Expense Sheet Format in Excel
<< Go Back to Tracker in Excel | Excel Templates
Get FREE Advanced Excel Exercises with Solutions!
