What is Scenario Manager in Excel?
Scenario manager in Excel is an element of three what-if-analysis tools in Excel, which are in-built features in excel. You can notice the effect of switching input values without altering the existing data. It works like the data table in Excel. You must input data that should change to acquire a particular outcome.
Scenario Manager in Excel lets you change or replace input values for numerous cells. You will be able see the output of different inputs or different scenarios at the same time.
How to Perform Scenario Analysis in Excel
Scenario:
You’re looking for a rental house. There are some available options to choose from. We can consider these options as scenarios. You have to decide which house you want before making the final decision in order to save more money.
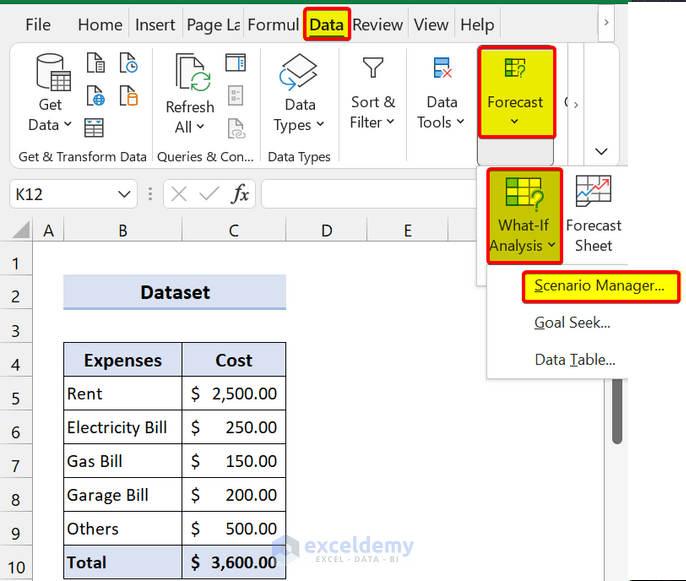
To illustrate this, we will use the following sample dataset:
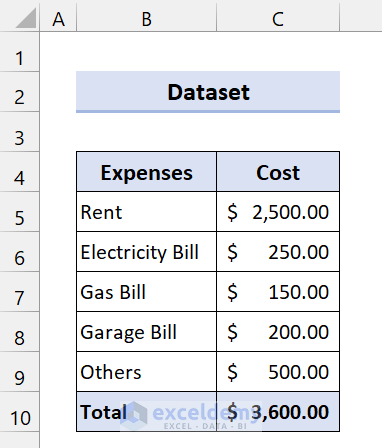
This is for House 1. We will create a scenario for House 2 and House 3.
Steps
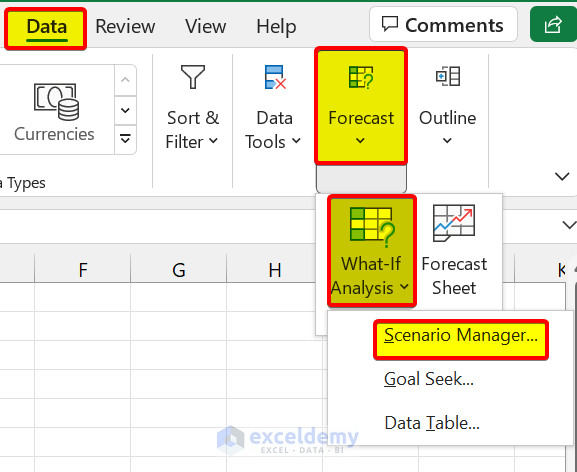
- Go to the Data From the Forecast group, select What-If Analysis > Scenario Manager.
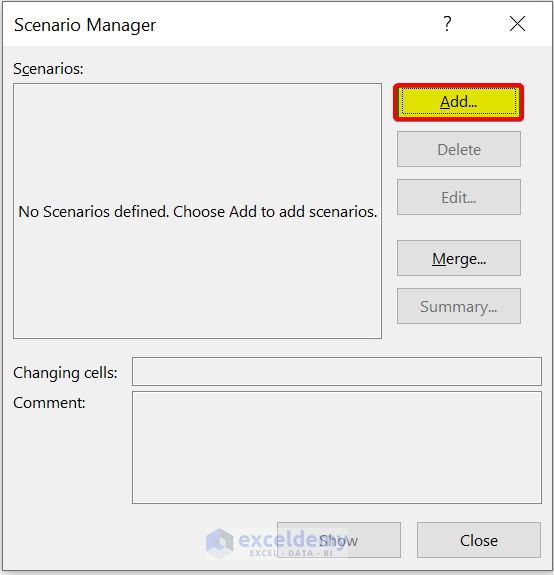
- In the Scenario Manager dialog box, click on Add.
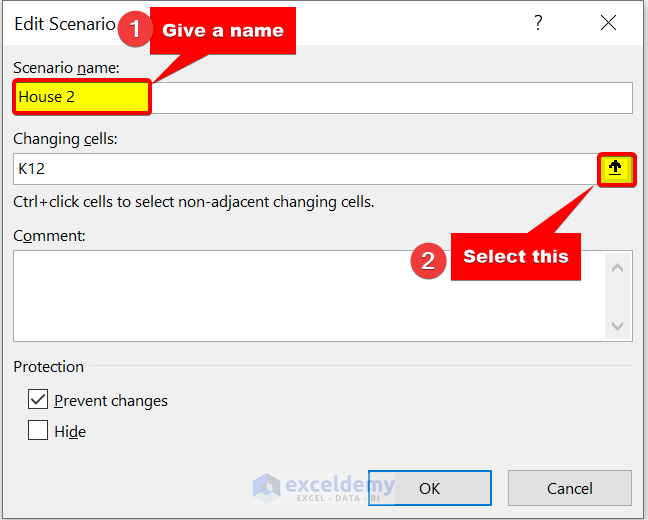
- In the Edit Scenario dialog box, enter a Scenario name. We have entered, House 2. Select Changing cells.
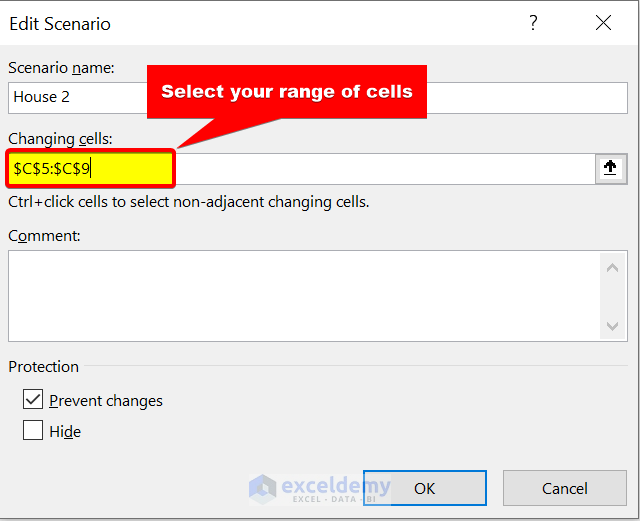
- Select the range of cells C5:C9. We will change these inputs.
- Click on OK.
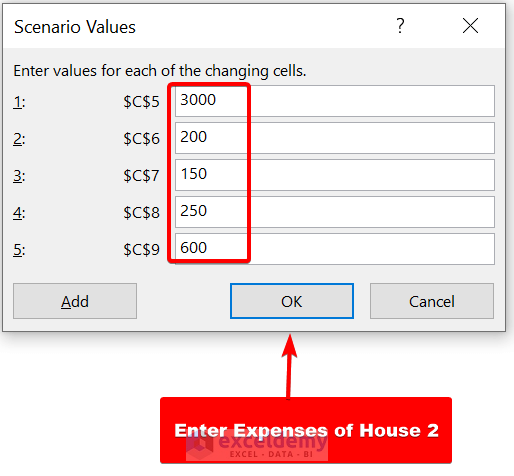
- In the Scenario values dialog box, we will enter the expenses of House 2. Click on Ok.
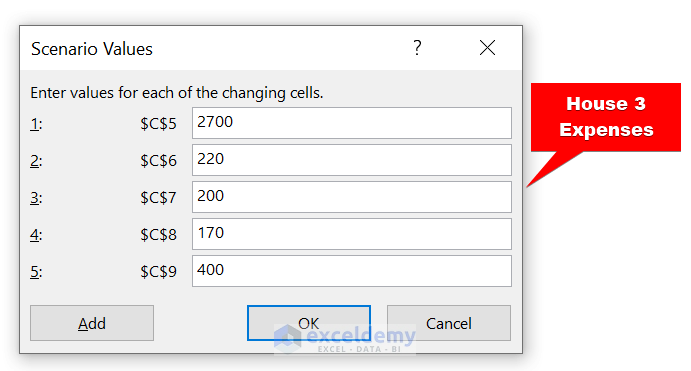
- We have added a scenario for House 2. Do the same for House 3.
- We have entered the following values for House 3.
- We added both scenarios. Select House 2 and click on Show to see the changes.
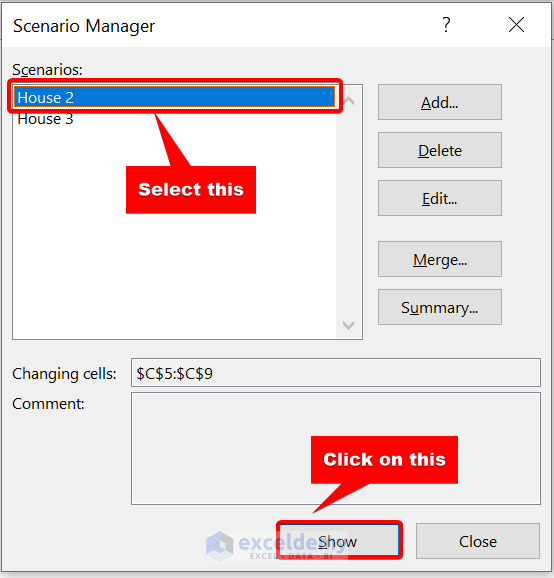
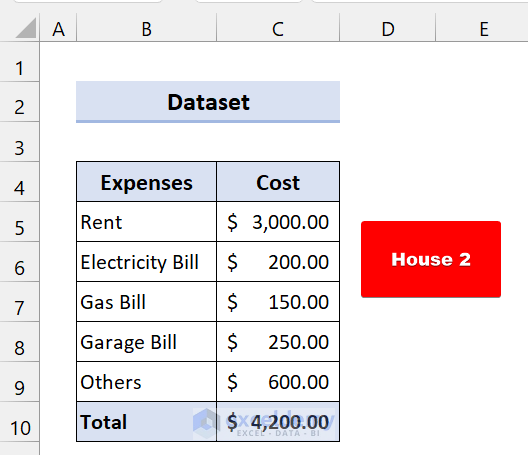
- The changes for House 2 will be displayed.
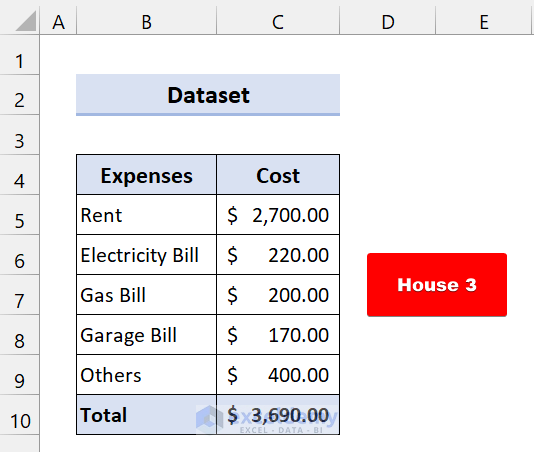
- If you choose House 3, it will give you the following total cost:
Create Scenario Summary:
You can also show effects side-by-side using the Scenario Summary.
Steps
- Open the Scenario Manager.
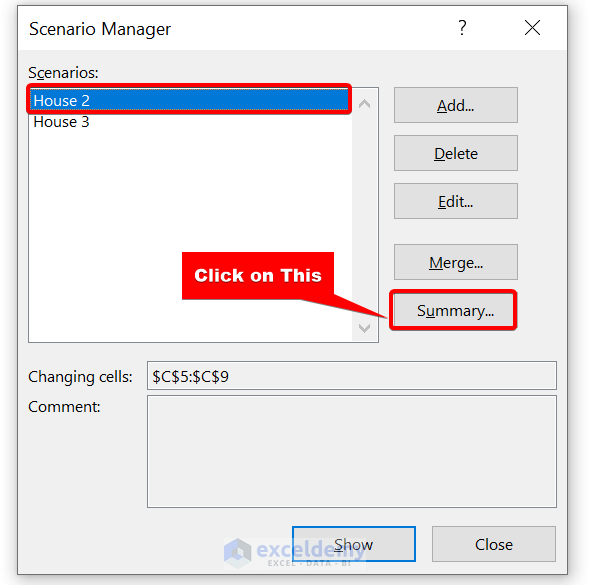
- Click on Summary.
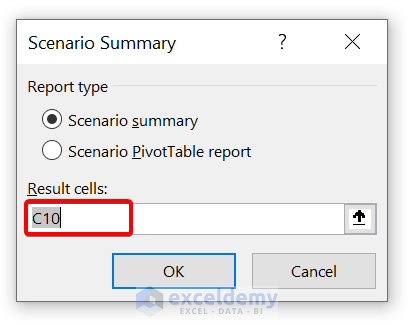
- Select your Result cells. Our result cell is C10 because we were showing our Total values on that cell. Click on OK.
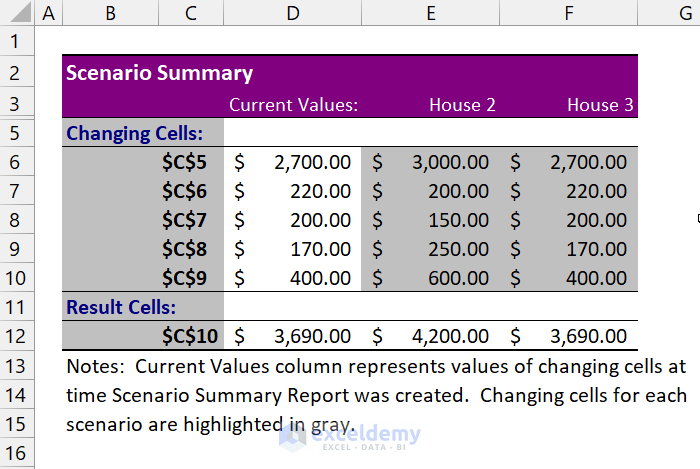
You can see the side-by-side scenario summary in a different worksheet.
Read More: How to Use Scenario Manager in Excel
Scenario Analysis in Excel: 2 Practical Examples
Example 1 – Scenario Analysis of Compound Interests in Excel
In this section, we will use an example of the Compound interests of banks. We will create two scenarios of this example for illustration.
Compound interest means earning or paying interest on interest. It is one of those popular financial terms. When we think about compound interest, we consider it as gaining money. It increases our savings after a limited period.
The formula of Compound Interest:
This example will be used in the same dataset. But we will calculate compound interests separately.
Suppose you want to invest $10000 for ten years. You have got three options:
Bank "X" is providing 5% interest compounded yearly.Bank "Y" is offering 5% interest compounded monthly.Bank "Z" is giving 5% interest compounded daily.
We will use the scenario manager to find which bank will give more interest.
This is the dataset for Bank “X”:
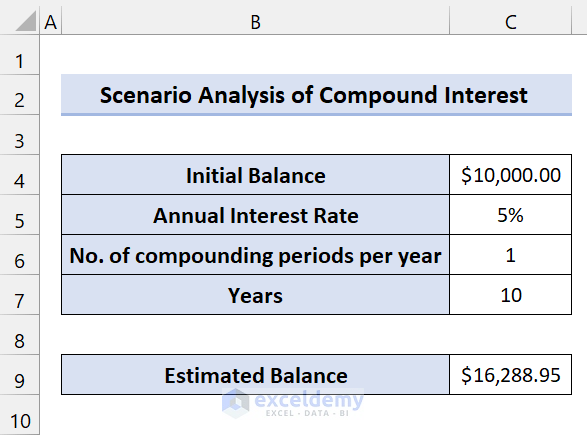
Enter the following formula to calculate the Estimated Balance:
=C4 * (1 + C5 /C6) ^ (C7 * C6)Create a scenario analysis.
Steps
- Go to the Data From the Forecast group, select What-If Analysis > Scenario manager.
- In the Scenario Manager dialog box, click on Add.
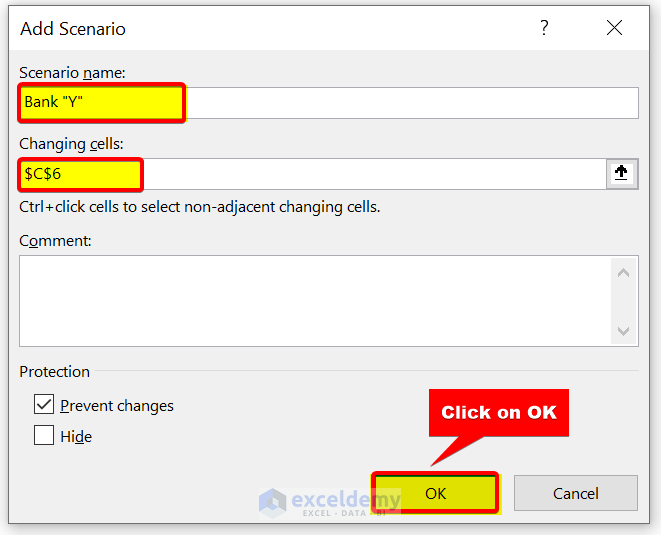
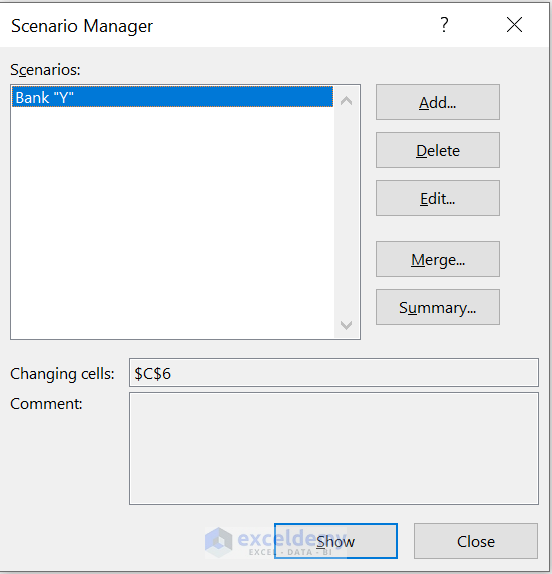
- In the Edit Scenario dialog box, enter a Scenario name. We have entered Bank “Y”. Select cell C6 in Changing cells (because only the number of compounding periods per year will vary here. Everything will be the same). Click on OK.
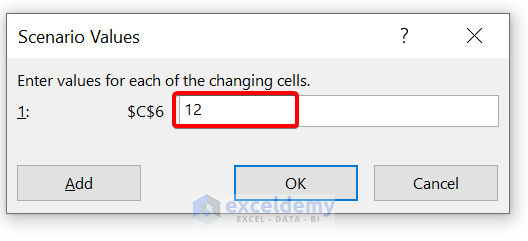
- In the Scenario Values dialog box, enter 12 (because Bank “Y” gives 5% compound interest monthly. So, there will be 12 compounding periods per year). click on OK.
- We have created a scenario for Bank “Y”.
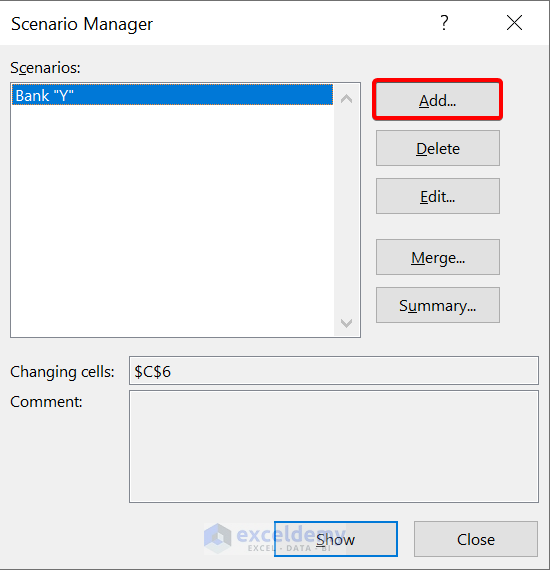
- To add a scenario for Bank “Z”, click on Add.
- We have named this scenario, Bank “Z”. Select cell C6 as the changing cell.
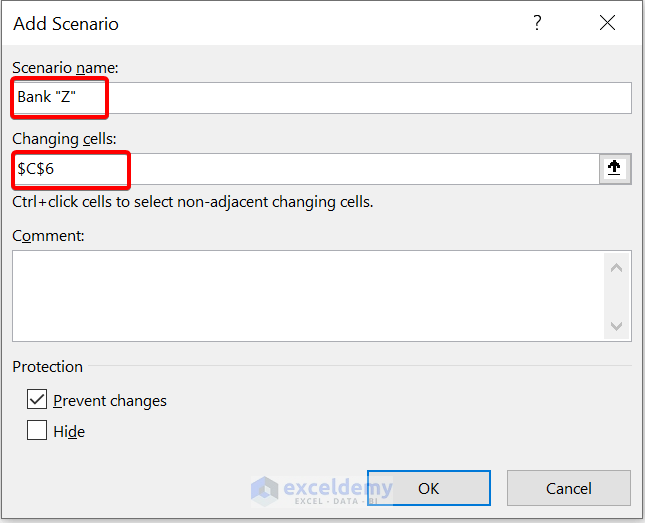
- Enter the scenario values 365 (because Bank “Z” is offering 5% interest compounding daily. So, no. of compounding periods will be 365 days).
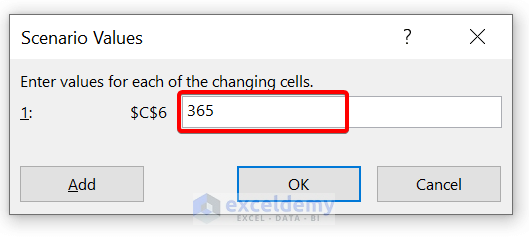
- Click on OK.
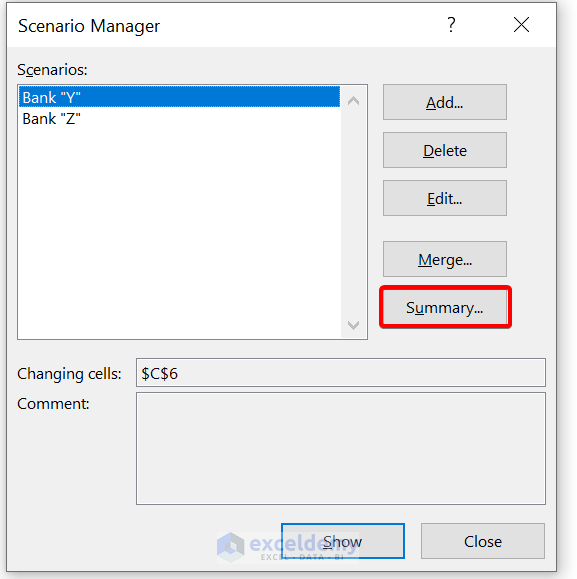
- To create a scenario summary report, click on Summary. Select cell C9 as the result cell.
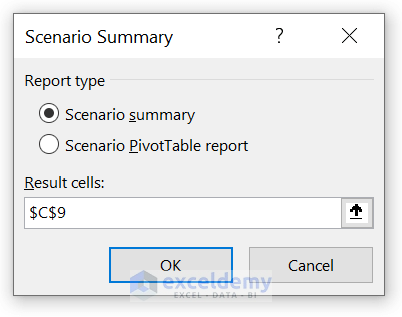
- Click on OK.
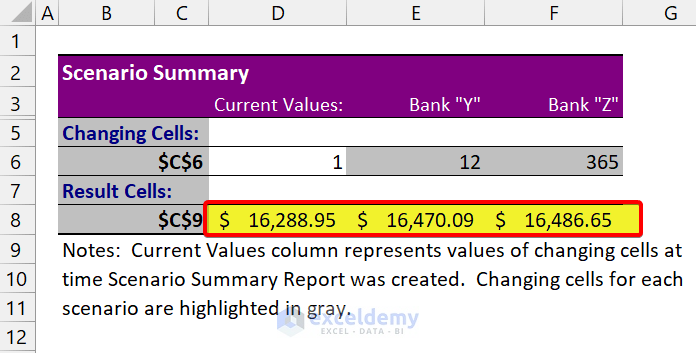
We have successfully created a scenario analysis. You can see the estimated balance for each compound interest of the banks.
Example 2 – Preparing Budget for an Office Tour Using Scenario Manager
Your office has decided to go on an office tour. Your boss has given you the responsibility to make the budget. You have three options to choose from.
You have made the following budget for Place 1:
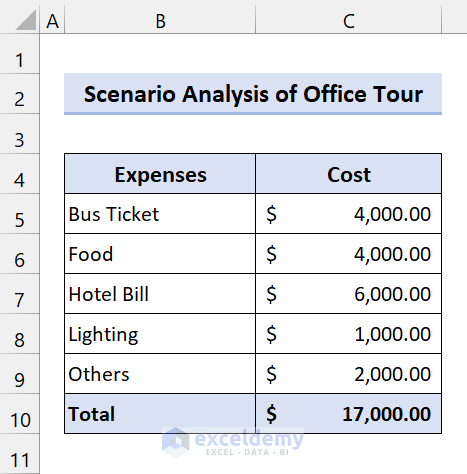
You have to make a budget for Place 2 and Place 3.
Steps
- Go to Data, from the Forecast group, select What-If Analysis > Scenario manager.
- The Scenario Manager dialog box will pop-up. Click on Add.
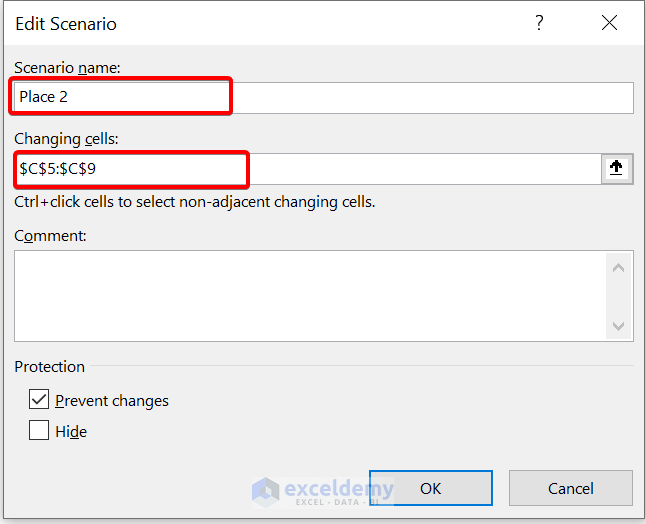
- In the Edit Scenario dialog box, enter a Scenario name. We have named it Place 2. Select the range of cells C5:C9 in Changing cells. Click on OK.
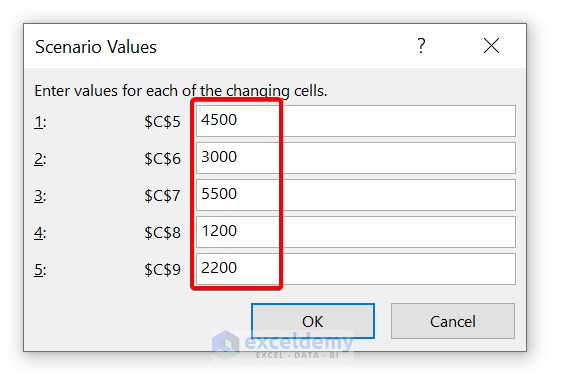
- Enter the expenses for Place 2.
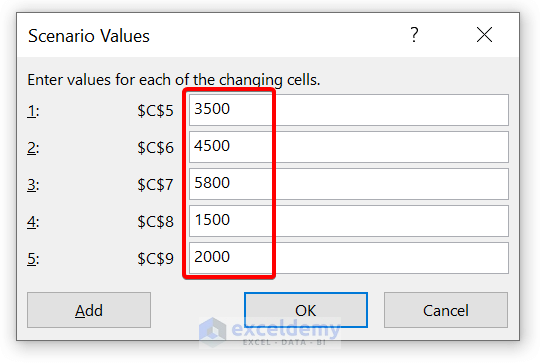
- Click on OK.
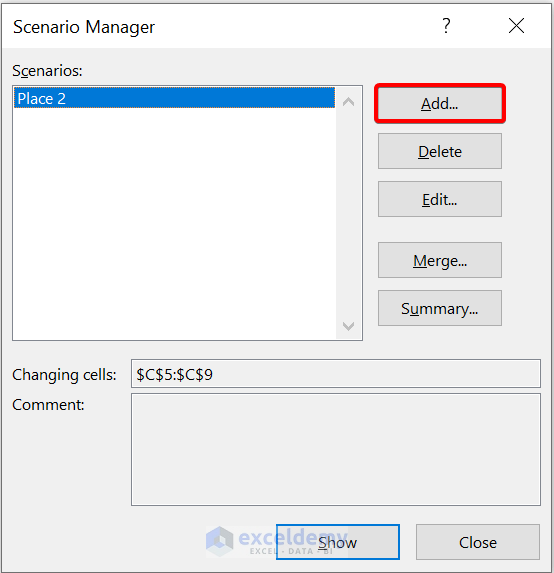
- We have added the Place 2 scenario.
- Create a Scenario for Place 3 following the above steps. Enter your expenses for Place 3.
- Click on OK.
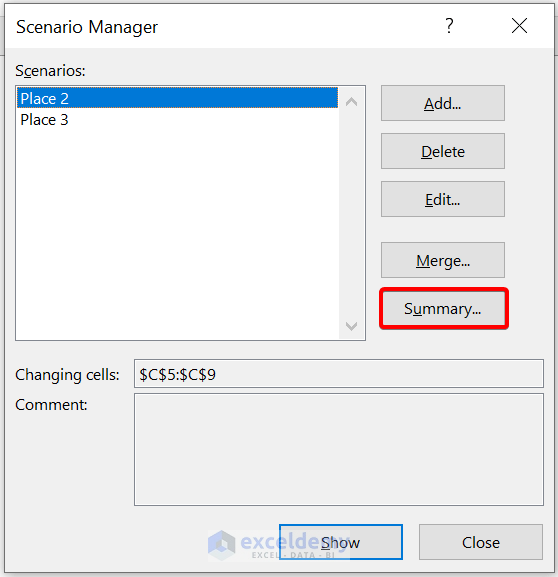
- Click on Summary to analyze the scenarios side-by-side. Select cell C10 for showing the result.
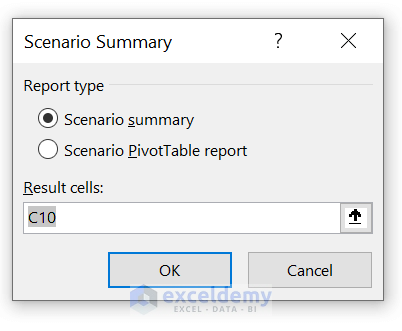
- Click on OK.
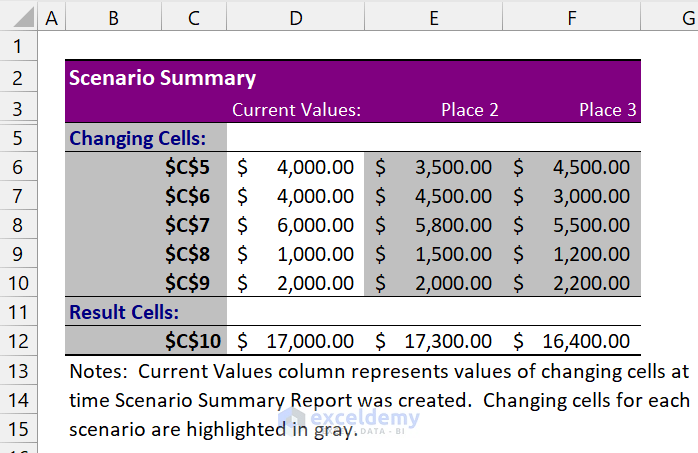
We have successfully performed the scenario analysis of an office tour.
Read More: How to Create a Scenario Summary Report in Excel
Things to Remember
✎ By default, the summary report uses cell references to recognize the Changing cells and the Result cells. If you make named ranges for the cells before you run the summary report, the report will have the names instead of cell references.
✎ Scenario reports do not automatically recalculate. If you modify the values of a scenario, those modifications will not show up in a current summary report but will show up if you build a new summary report.
✎ You don’t require result cells to generate a scenario summary report, but it is required for a scenario PivotTable report.
Download Practice Workbook
Further Readings
- How to Create Scenarios in Excel
- How to Edit Scenarios in Excel
- How to Remove Scenario Manager in Excel
<< Go Back to What-If Analysis in Excel | Learn Excel
Get FREE Advanced Excel Exercises with Solutions!

Thank you for sharing Shanto! I found a problem that also appears in your article. In the Scenario Summary for section 1 example, the “Current Values” column shows data for House 3 as the result of the last operation. How to retrieve the original data for House 1?
Hello HOWARD,
Thanks for asking this important question. Basically scenario summary will show the latest dataset in the current values column. As we changed the scenario by clicking OK.
Now, this is not a wonderful solution. But it may help you.
1. Copy the original dataset to a new sheet.
2. Then go to Scenario Manager
3. Now click Summary.
You will see the original data in Current Values.
Thank You.