Create a Default Scenario Summary Report in Excel
Create a default scenario summary report in Excel. It is also known as a static scenario summary report.
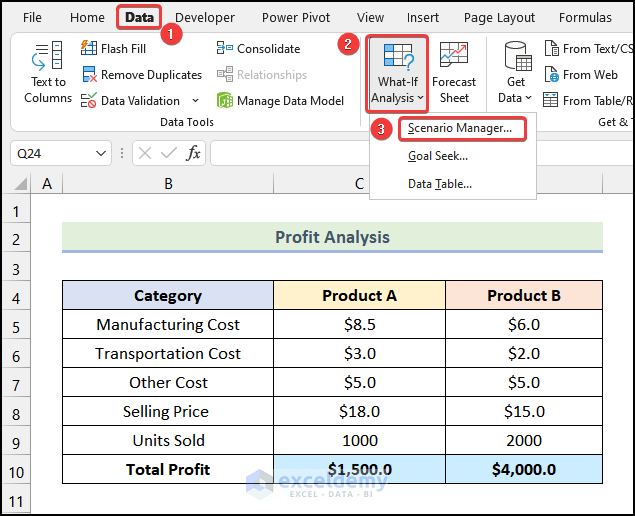
- Go to the Data tab from Ribbon.
- Select the What-If Analysis option.
- Click on the Scenario Manager option from the drop-down.
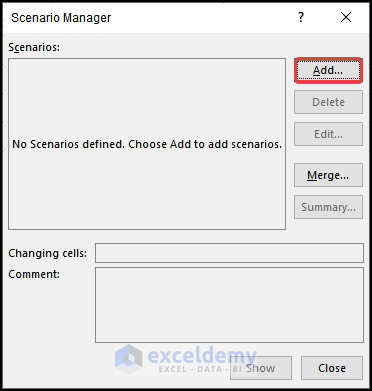
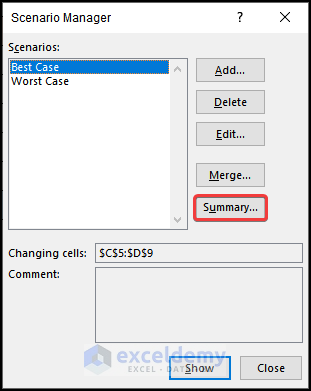
The Scenario Manager dialogue box will open on your screen, as shown in the following picture.
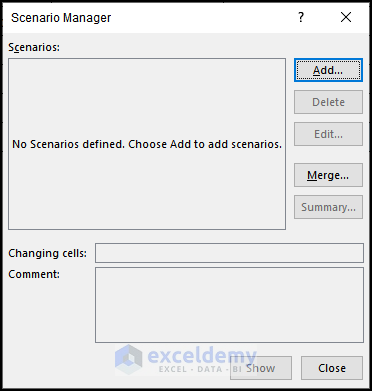
- Click on the Add option from the Scenario Manager dialogue box.
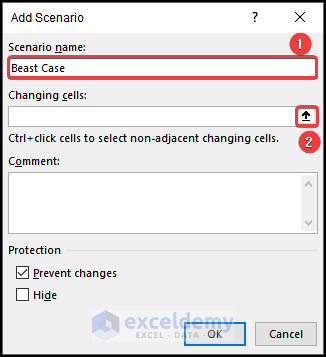
The Add Scenario dialogue box will be visible on your worksheet.
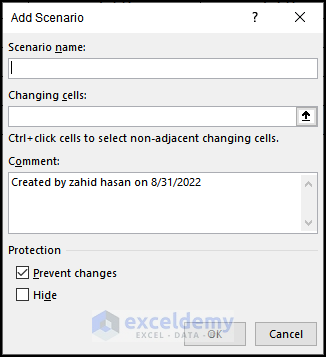
- From the Add Scenario dialogue box, type the scenario name you want in the Scenario Name box. We typed in Best Case.
- Click on the marked region of the following image.
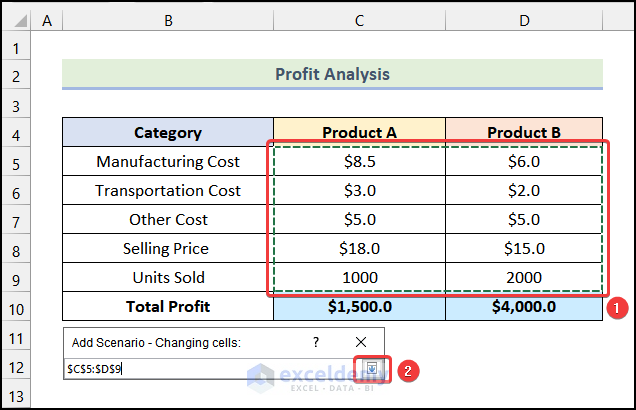
- Choose the range of cells where the inputs will change. We selected the range $C$5:$D$9.
- Click on the marked area of the image below.
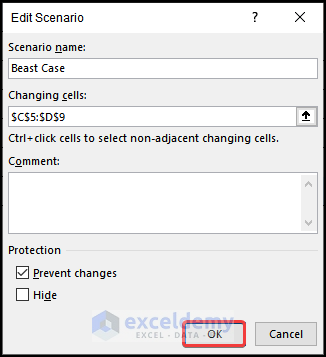
- Click OK from the Edit Scenario dialogue box.
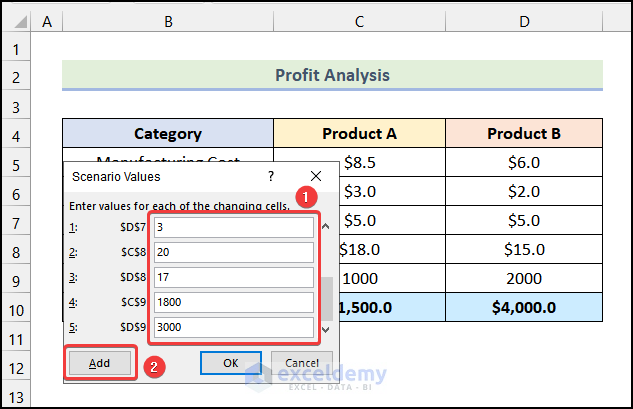
- Type in the values for the Best Case scenario in the marked boxes shown in the following picture.
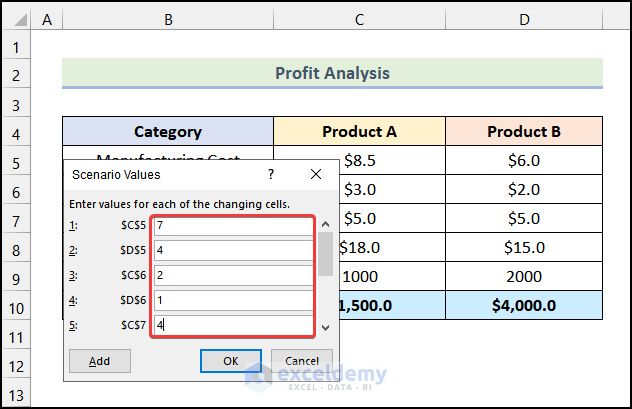
- After typing in the values, click Add in the Scenario Values dialogue box.
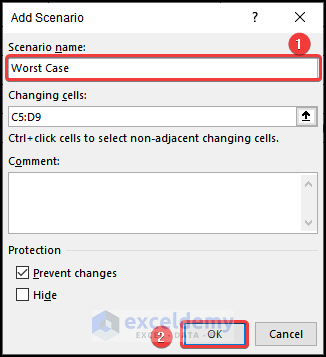
- Type in the name of the second scenario. We used the name Worst Case.
- Click on OK.
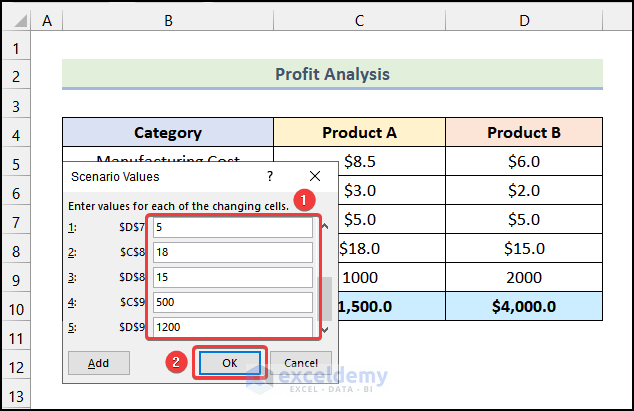
- Type in the values for the Worst Case scenario, as shown in the following image.
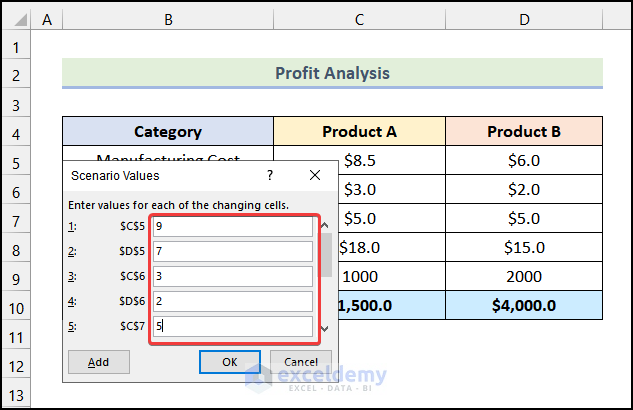
- After inserting the values for the Worst Case scenario, click on OK.
- As a result, you will be redirected to the Scenario Manager dialogue box and click on Summary from the dialogue box.
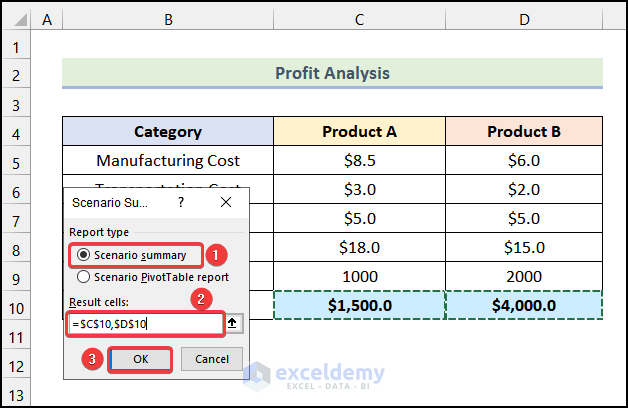
The Scenario Summary dialogue box will open on your worksheet.

- From the Scenario Summary dialogue box, choose the Report Type as Scenario Summary.
- Press and hold the CTRL key and select cells C10 and D10.
- Click on OK.
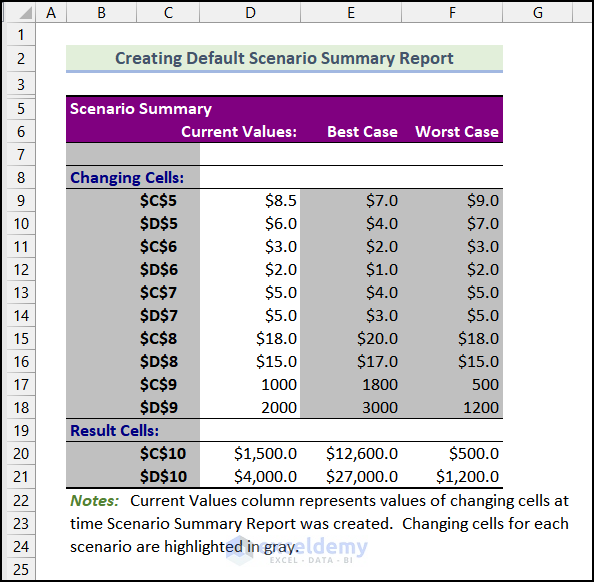
You reated a scenario summary report in Excel, which should look like the following image.
Make a Scenario PivotTable Summary Report in Excel
Steps:
- Follow the steps mentioned in the 1st method to obtain the following output.
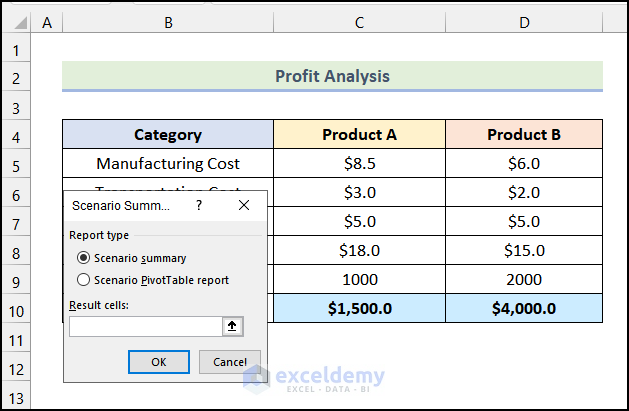
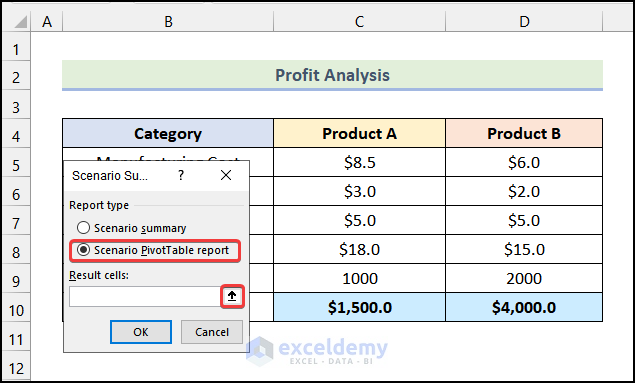
- Choose the Scenario PivotTable report option from the Scenario Summary dialogue box.
- Click on the marked region of the image given below.
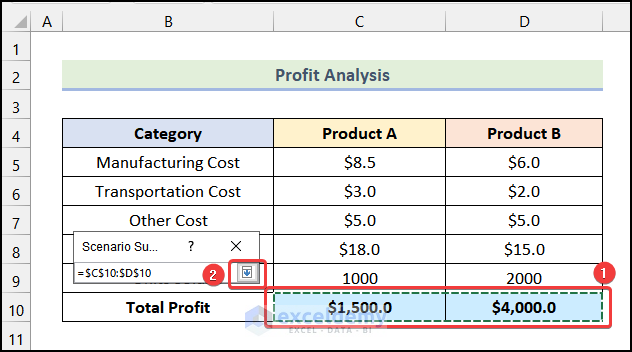
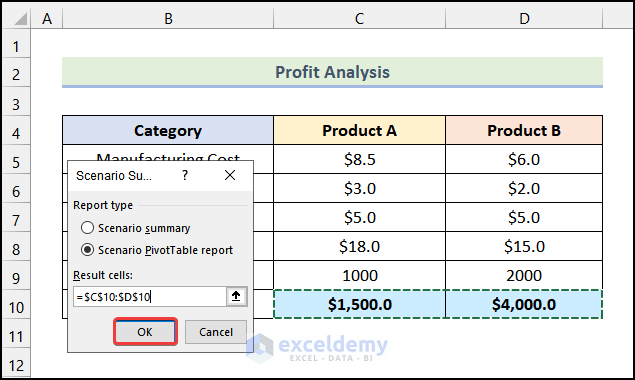
- Choose the range of cells $C$10:$D$10 as the Result cells.
- Click on the marked portion of the following picture.
- Click on OK.
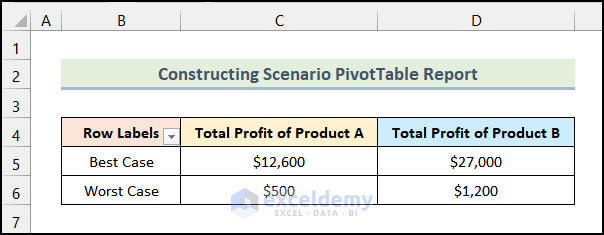
You will have your scenario summary report in a PivotTable format.
Related Articles
- How to Use Scenario Manager in Excel
- How to Create Scenarios in Excel
- How to Edit Scenarios in Excel
- Scenario Analysis in Excel
- How to Remove Scenario Manager in Excel
<< Go Back to What-If Analysis in Excel | Learn Excel
Get FREE Advanced Excel Exercises with Solutions!
