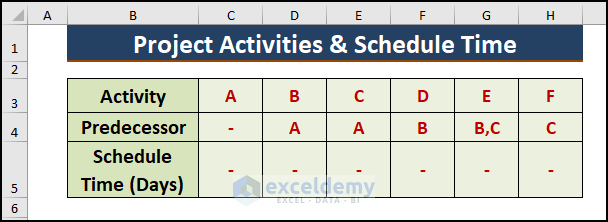
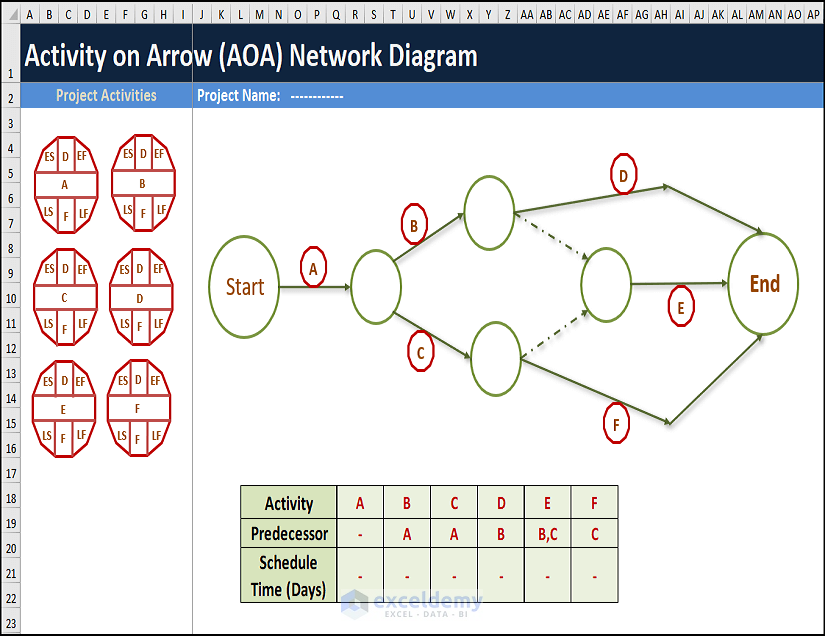
Method 1 – Entering Activities, Predecessors, and Schedule Times of Project
- Divide the entire project into multiple activities such as A, B, C,
- Determine the activities that need precursor activities.
- Enter all the activities and schedule times, maintaining the activity flow.
Method 2 – Maintaining a Fixed Segment to Depict Activities and Schedule Times
- Go to Insert.
- Choose single or multiple Shapes (i.e., Dodecagon and Line) types.
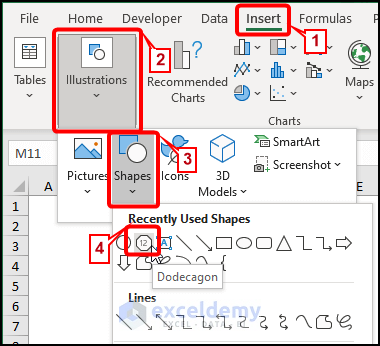
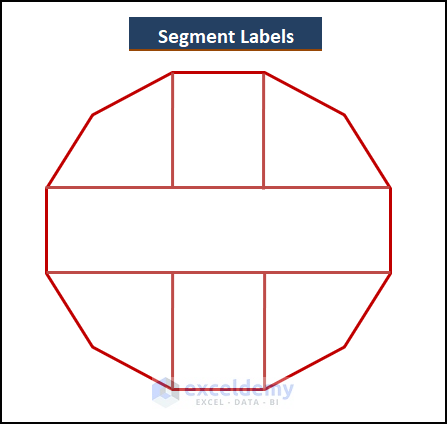
- Modify the shapes to a desired design to form a segment like in the picture below.
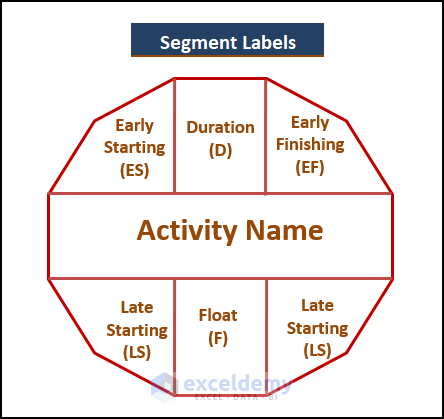
Method 3 – Inserting Segment Labels
After forming the inserted shapes into segments, users need to insert schedule timelines within them. As we have 6 different activities to complete the project, each segment needs to be the same size and format. The segment labels are
- Early Starting (ES)
- Duration (D)
- Early Finishing (EF)
- Late Starting (LS)
- Float Time (F)
- Late Finishing (LF)
Method 4 – Drawing AOA Network Diagram Layout in Excel
As soon as users finalize their segment form and label assignment, they can select any of the diagram layouts depending on their needs. The diagram layout symbolizes the essence of the entire project. The network diagram layout must be able to visualize the consecutive activities to finish the project successfully.
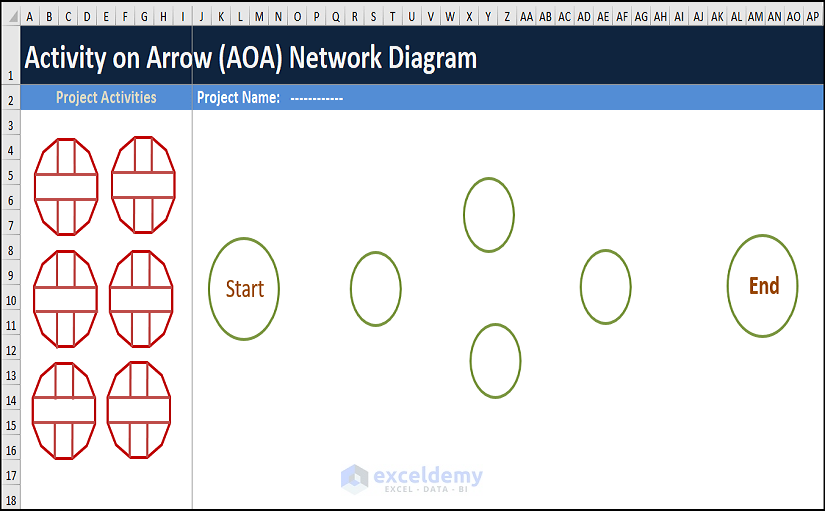
Method 5 – Creating an AOA Network Diagram Maintaining Its Layout
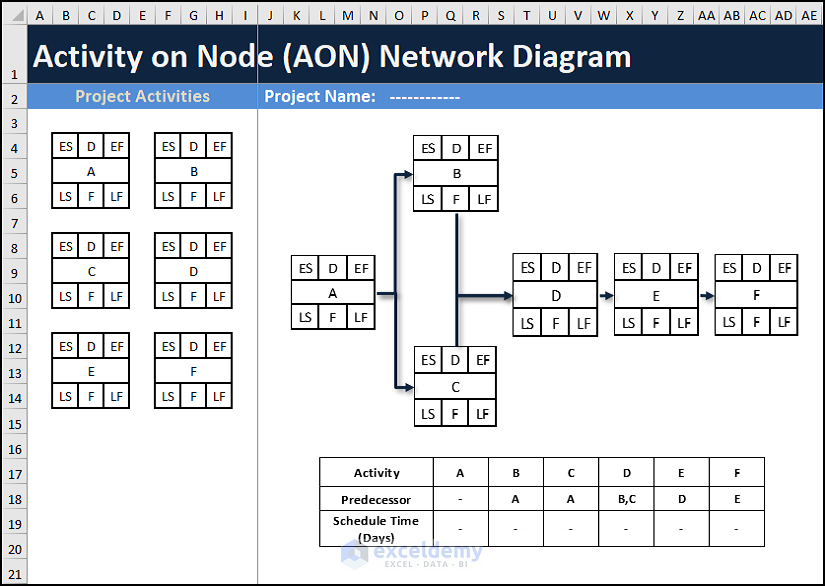
The AOA network diagram layout or a project network diagram has 2 distinctive parts, Project Activities, and the Network Diagram.
- Insert suitable Shapes to indicate the network flow among activities. Go to Insert > Shapes (Illustrations) > Line Arrow to choose the desired shapes.
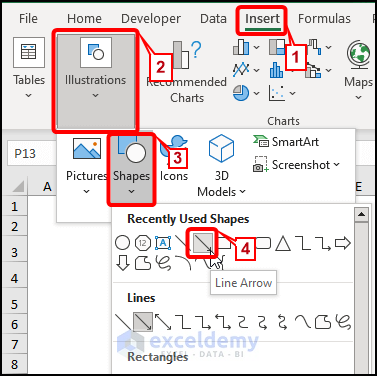
- Modify the shapes using the Shape Format tab to look like the below image.
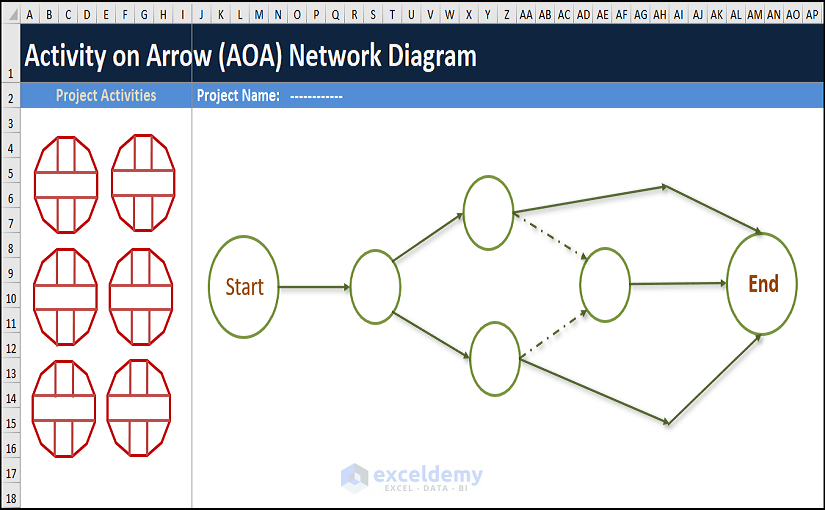
- Furnish the AOA Network Diagram. In the end, the diagram may look like the below image.
Activity on Arrow (AOA) vs. Activity on Node (AON)
Activity on Arrow (AOA) Network Diagram
In AoA network diagrams, displaying start-to-finish relationships is not that important. Arrows represent the period of a project from start to finish events. Activities on arrows display complicated relations and dependencies.
Activity on Node (AON) Network Diagram
In AON network diagrams, the activities are depicted on nodes. The interlink arrows illustrate activity flow and dependencies among activities. The nodes can be anything in shape or form. An AON diagram depicts the predecessor relationships.
Related Articles
- How to Create a Network Diagram in Excel
- How to Create a Project Network Diagram in Excel
- How to Draw CPM Network Diagram in Excel
<< Go Back to Network Diagram in Excel | Learn Excel
Get FREE Advanced Excel Exercises with Solutions!
