Method 1 – Create a Primary Diagram with Boxes and Lines
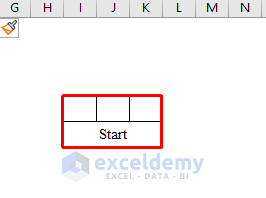
- Create a cell with some borders, like the following screenshot.
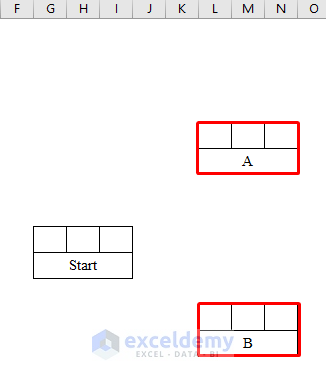
- Draw some more boxes for project activities A and B.
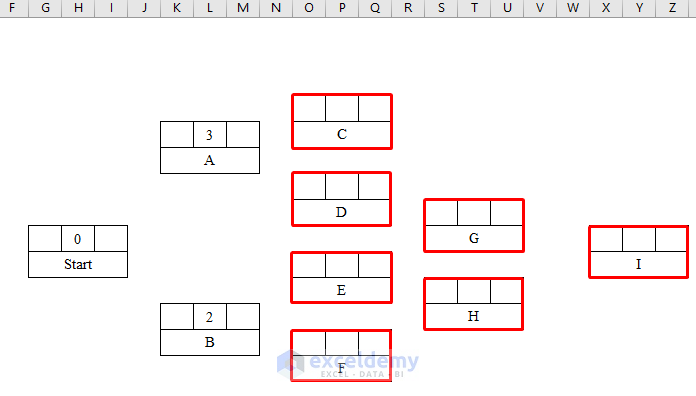
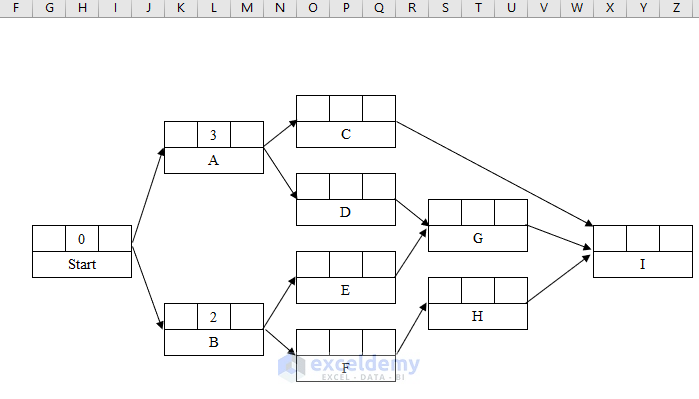
- Draw boxes according to the arrangement for all the project activities like the screenshot below.
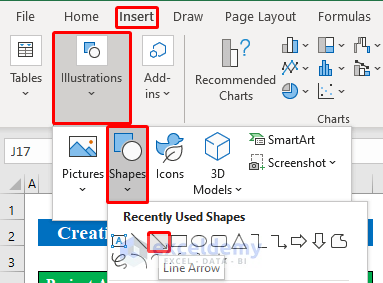
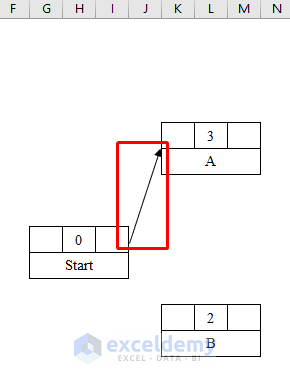
- To connect them, we need to insert lines between the boxes.
- Choose Line Arrow from the Shapes option.
- Draw a line between “Start” and “Project Activity-A” to connect them.
- Draw lines to connect all the boxes to complete the network diagram.
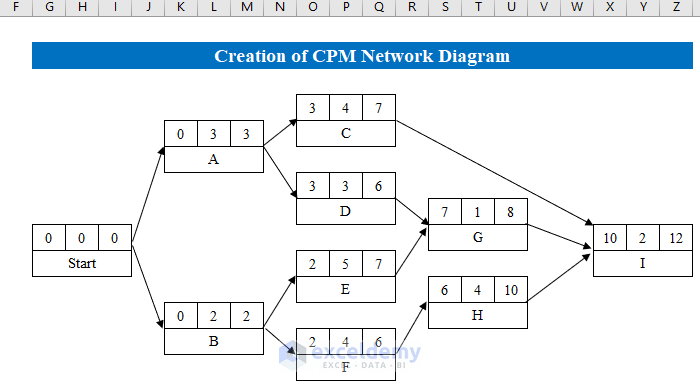
Method 2 – Put Values into Diagram from Dataset
- Count the total days required to complete the project.
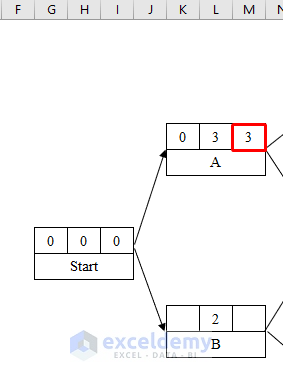
- Put the values inside the drawn boxes from the list.
- To connect the starting of the project and “Activity A,” we will put “0” as the starting days are still “Nil.”
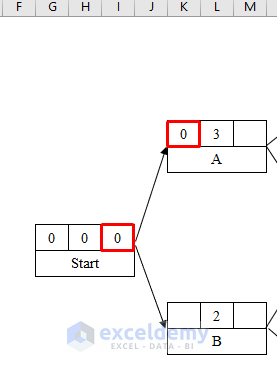
- As Project Activity-A needs 3 days to complete, the total is 0+3=3 days.
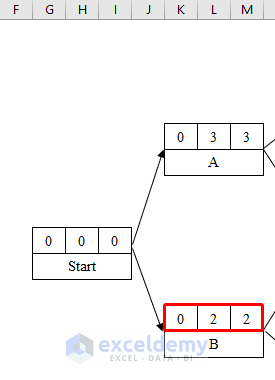
- Similarly, for project activity B, the total stands at 0+2=2.
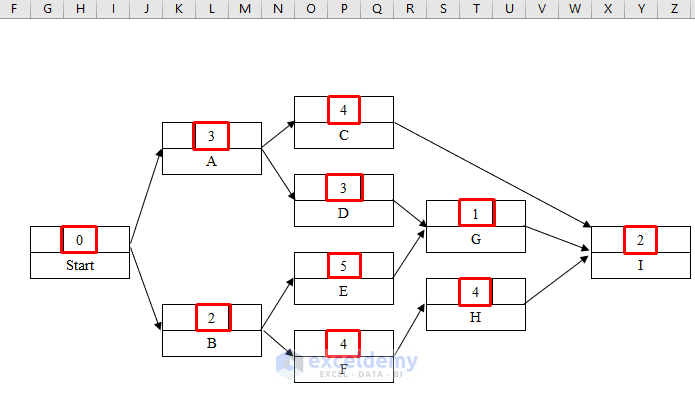
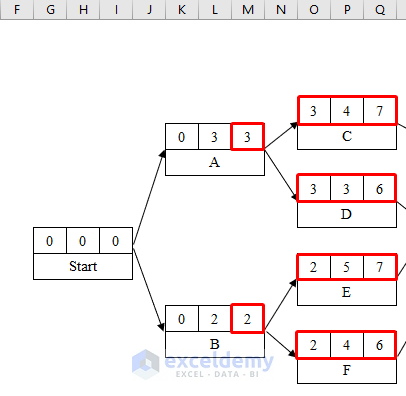
- Calculate the days needed for project activities C, D, E, and F.
Method 3 – Complete the CPM Network Diagram
- Now if we come to Project Activity G you will see we have put 7 instead of 6.
- The reason is that as activities D and E are both connected with Project Activity-G, we have to take the highest number of days, which also represents an idle day for Activity-D.
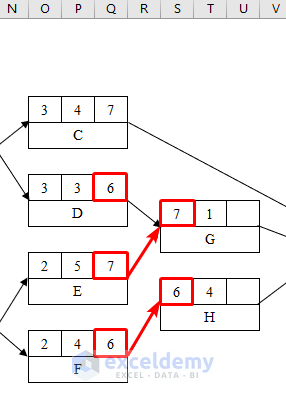
- Calculate all the values until the end of the project.
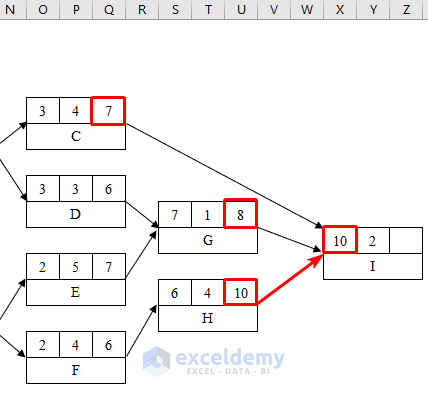
- You have successfully drawn our CPM network diagram, indicating the 12 days needed to complete the project.
Things to Remember
- You can also insert a Text Box from the Insert option to draw boxes. But you won’t be able to draw borders inside the Text Box.
Download Practice Workbook
Download this practice workbook to exercise while you are reading this article.
Related Articles
- How to Create a Project Network Diagram in Excel
- How to Draw AON Network Diagram on Excel
- How to Draw AOA Network Diagram in Excel
<< Go Back to Network Diagram in Excel | Learn Excel
Get FREE Advanced Excel Exercises with Solutions!
