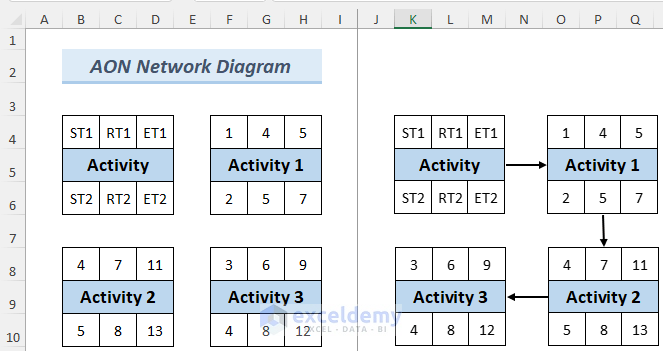
Below is a template to draw an AON network diagram. The acronym ST stands for Start Time, RT for Run Time and ET for End Time.
Method 1 – Drawing an AON Network Diagram with the CopyPaste Feature
Steps:
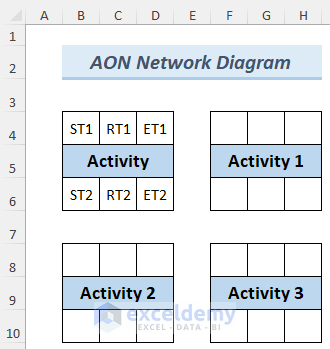
- Make an Excel data entry chart like the following picture. You may create network blocks if you need to. Here, I used borders and decreased the column width, and increased the row height a bit.
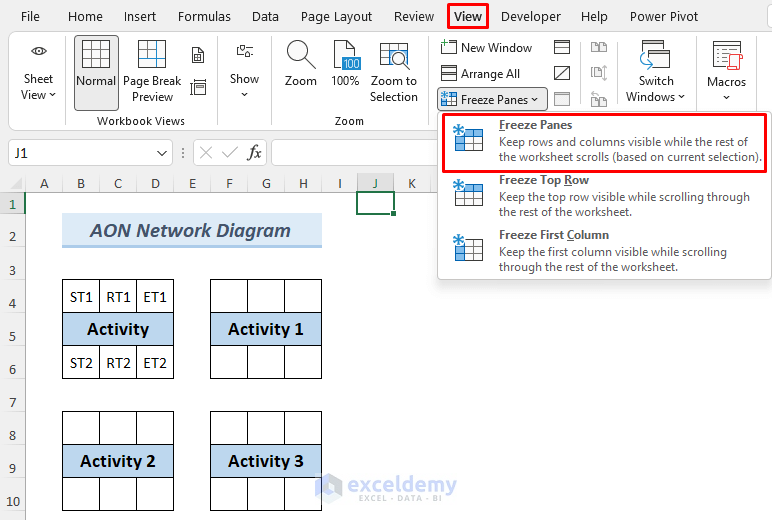
- Use the Freeze Panes feature to make the data look convenient. If you have more network blocks, use the Freeze Panes.
- To add Freeze Panes, select any cell from a column where your Freeze Pane will start and go to View >> Freeze Panes.
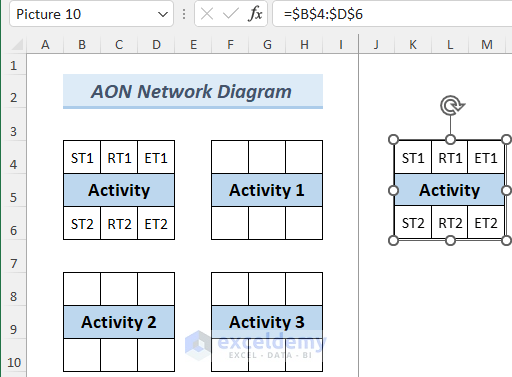
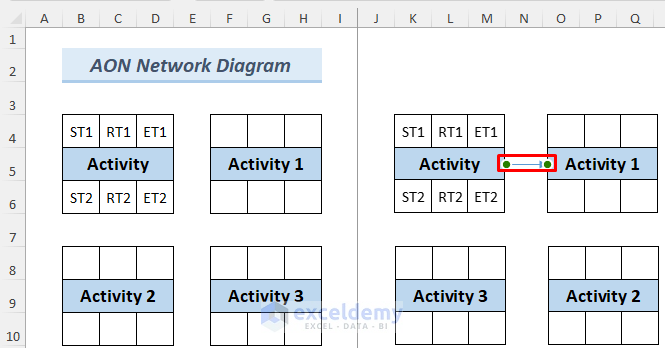
- Copy the first block (Activity Block) by selecting the range B4:D6 and pressing CTRL+C.
- Paste it as a Linked Picture on the other side of the Freeze Pane.
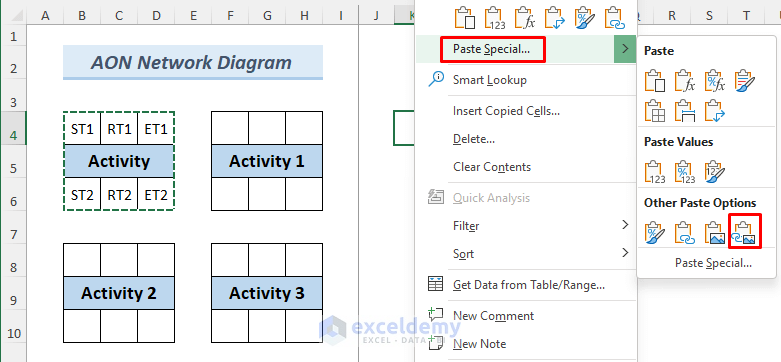
- You will see that the array B4:D6 is stored as an absolute reference and an image.
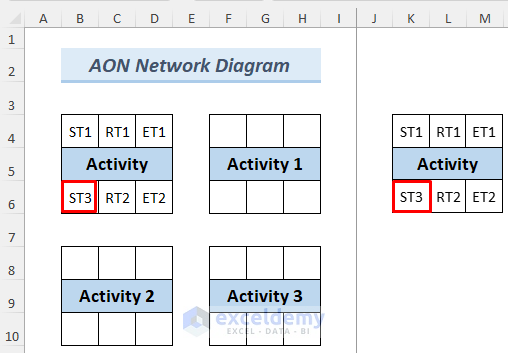
- If you change any cell in the B4:D6 range, it will automatically change the cell value of the linked picture.
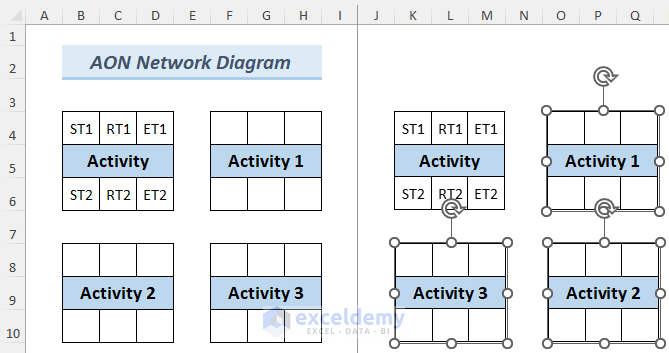
- Copy the blocks from Activity 1, 2, and 3 and paste them as linked pictures.
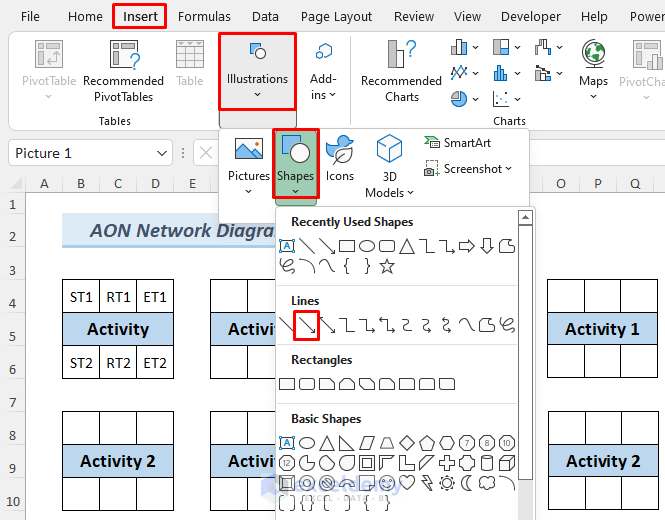
- Use some line arrows to show the activity flow chart.
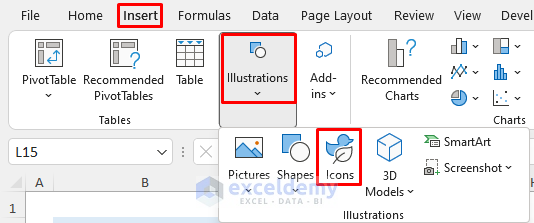
- Go to Insert >> Illustrations >> Shapes >> Line Arrow.
- Draw an arrow using the mouse like the following image.
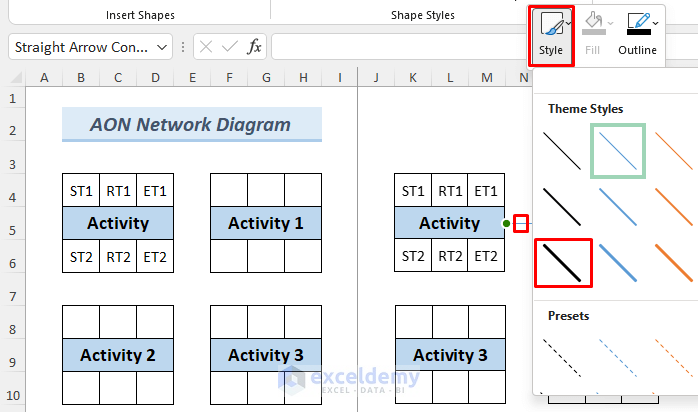
- You can change the color and shape of the line arrow if you want.
- Right-click on the arrow, go to Style and select a suitable theme style for you.
- Complete the AON network diagram by drawing those lines like the picture below.
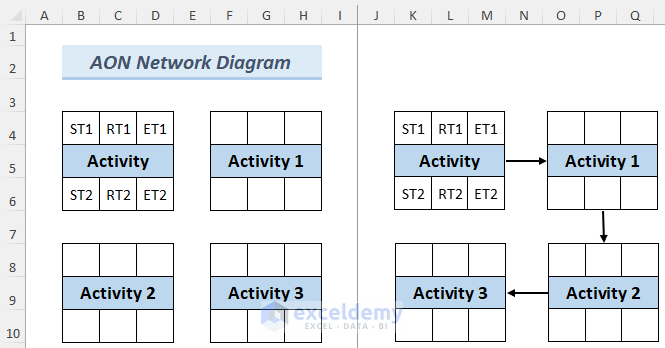
- Insert the activity data, and you will see these data automatically appear in the linked picture. The advantage of using linked pictures is that we can easily apply the shapes (Line Arrow). It’s convenient to create an AON network diagram template with linked pictures and insert data in the main block whenever needed.

You can draw an AON network diagram in Excel using the CopyPaste feature.
Read More: How to Draw AOA Network Diagram in Excel
Method 2 – Using Icons to Draw an AON Network Diagram for a Sports Event
Steps:
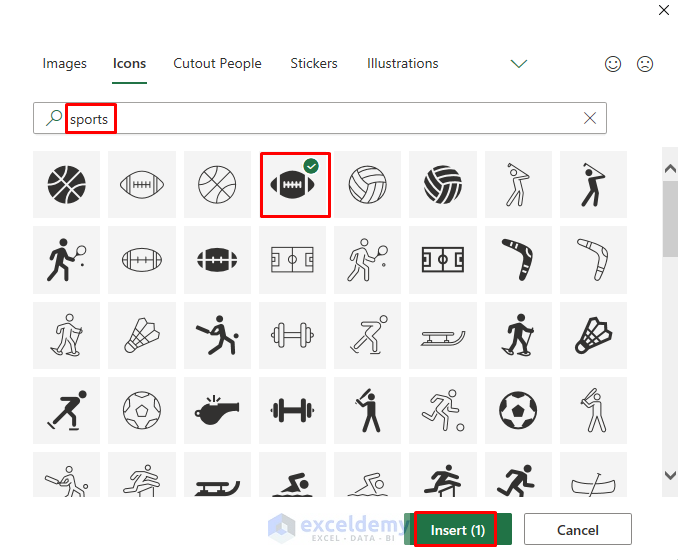
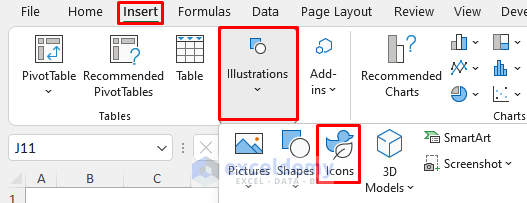
- Go to the Insert tab and then select Illustrations >> Icons.
- In the icons search bar, search for sports and you will get various types of sports icons.
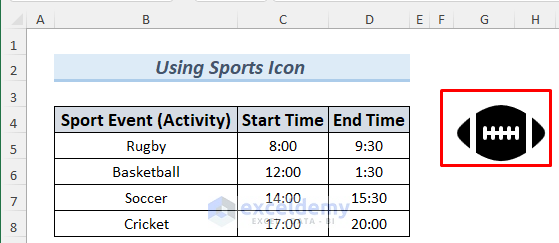
- As our first game is Rugby, select the Rugby icon and click on Insert.
- You will see that the Rugby icon appears in your Excel sheet.
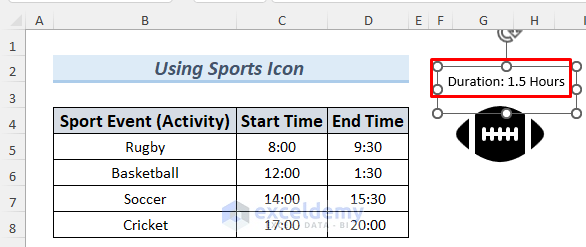
- Let’s use a Text Box to show the duration of the sports event.
- Go to Insert >> Text Box and select any cell on your Excel sheet. Type the information you need and place it in the appropriate cell.
- Insert the other sports icons and text boxes.
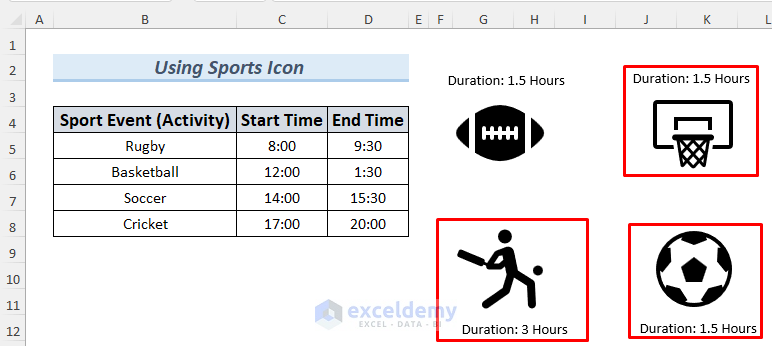
- Draw this AON network diagram using line arrows, as shown below. The application of line arrows is described in Section 1.
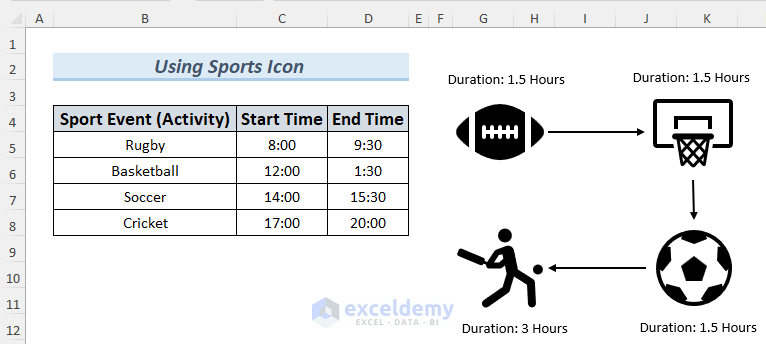
You can draw an AON network diagram in Excel using icons.
Read More: How to Draw CPM Network Diagram in Excel
Method 3 – Applying Excel Icons to Draw an AON Network Diagram for Router Transmission Process
Steps:
- Go to the Insert tab and then select Illustrations >> Icons.
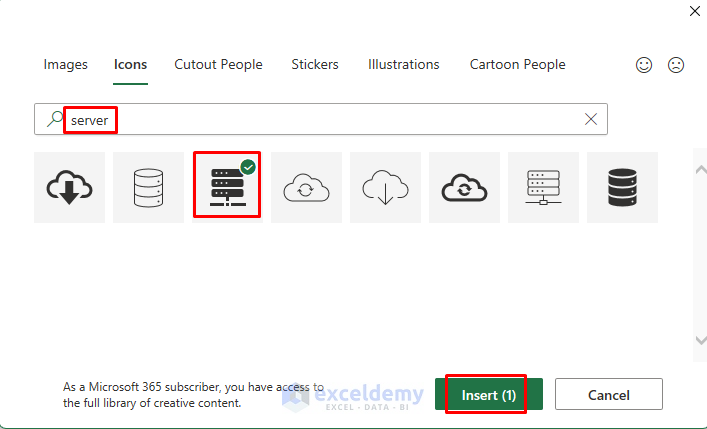
- In the Icons search bar, search for the Server icon, select it, and insert it into your Excel sheet.
- Insert the Modem, Router, Smartphone, Laptop and Desktop one by one. Conveniently arrange them.
- Use the line arrows to draw this activity network. Section 1 provides a detailed application of line arrows for this article.
- Use some text boxes to illustrate the data transmission process briefly.
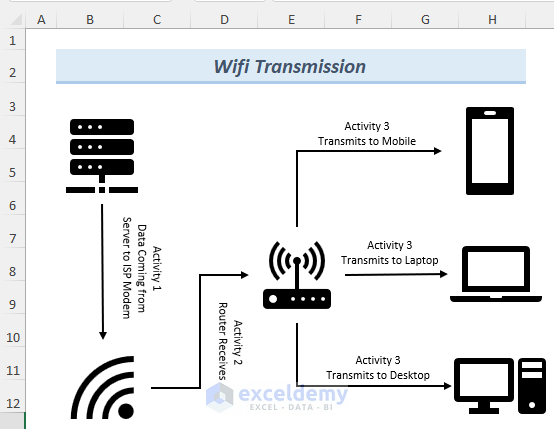
You can draw an AON network diagram to illustrate the data transmission process in a router.
Download the Practice Workbook
Related Articles
<< Go Back to Network Diagram in Excel | Learn Excel
Get FREE Advanced Excel Exercises with Solutions!

Great post! The examples were really helpful, and I appreciate the step-by-step instructions for drawing the AON network diagram in Excel. I always struggled with visualizing my project timelines, but this guide made it so much easier. Thanks for sharing!
Hello,
You are most welcome. Thanks for your appreciation. Glad to hear our step-by-step guide is helpful to you. Keep learning Excel with ExcelDemy!
Regards
ExcelDemy