What Is a Network Diagram?
The network diagram is a chart composed of boxes and arrows. Here, the boxes represent the activities performed, and the arrows show the sequence, one after another, according to a pre-developed schedule.
It also shows the interrelation of activities in different stages of the project. Moreover, a network diagram helps to determine the task’s completion period. Whether it was done early or late, you can easily find that information from a single network diagram.
Types of Network Diagrams in Excel
1. Arrow Diagram Method (ADM)
This type of diagram depicts terminal activities through arrows. Here, the length of the arrow is very important as it defines the duration of the activity. The precedences are represented by some circles that are connected with those arrows. Lastly, the tail and head show the start and end of the work. However, the Arrow Diagram Method (ADM) works only with a series of activities.
2. Precedence Diagram Method (PDM)
The Precedence Diagram Method (PDM) is more efficient in project management. Here, the activities shown in boxes are referred to as nodes. They are interconnected with arrows, which define the start and end of each activity. The main advantage of PDM is that it helps to show the internal correlation between several activities.
PDM shows the interrelation in these four ways:
- Finish-Start (FF): An activity must be done before going to the next one.
- Start-Start (SS): Both activities can start together at any stage.
- Finish-Finish (FF): Here, two tasks must be completed together.
- Start to Finish (SF): This is an unusual case where one activity needs to start before the other is completed.
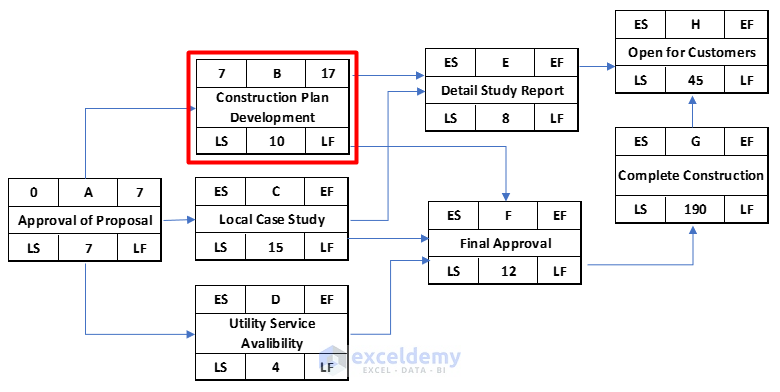
Below is a dataset showing information on the stages of a project. The chronology defines the start-to-end of each stage in the Description column. In the Label column, they are labeled with alphabets for better understanding. The dataset also shows the interrelation of activities with the title Predecessor. Lastly, it shows the duration of each activity.
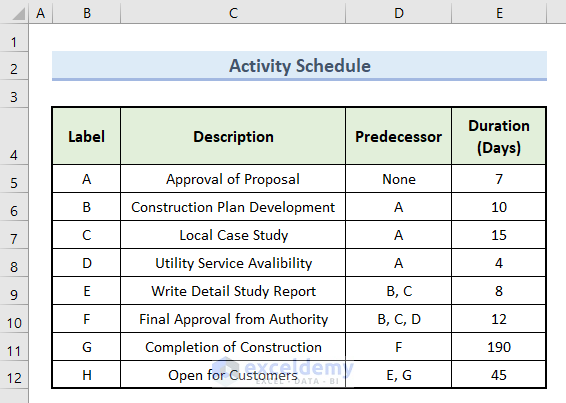
Let’s create a network diagram based on this dataset.
Step 1 – Make an Initial Activity Chart in Excel
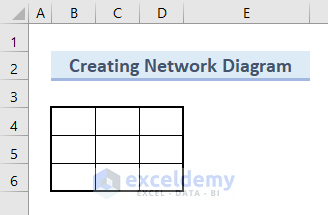
- Select cell range B4:D6.
- In these selected cells, create a 9 X 9 box like this:
- Insert the titles according to the dataset like this:
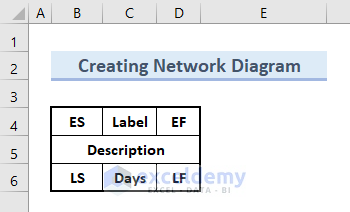
Here, ES and EF define the early start and finish times for that specific activity. Also, LS and LF show the late start and late finish times where applicable.
Step 2 – Insert Required Number of Activity List
- Copy the template above.
- Select cell B8.
- Paste the selected chart.
- Insert the information in the Label, Description, and Days boxes from the dataset.
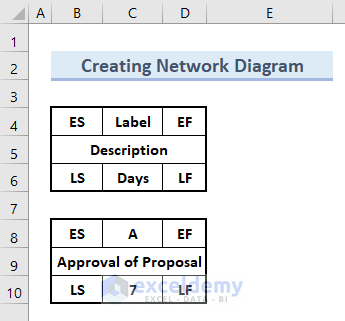
- Follow the same procedure for all the activities.
- Here is the final output of the activity list:
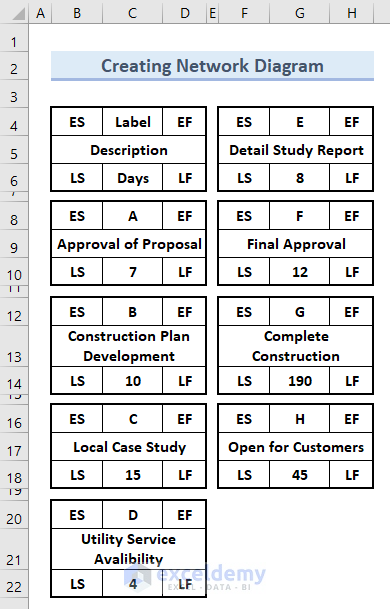
Step 3 – Create a Network Diagram in Excel
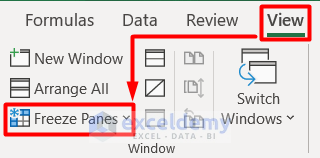
- Select column I.
- Go to the View tab and select Freeze Panes.
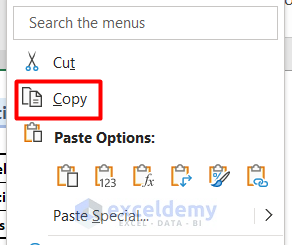
- Select the first activity list located in cell range B8:D10.
- Right-click on it and select Copy. Alternatively, press Ctrl + C.
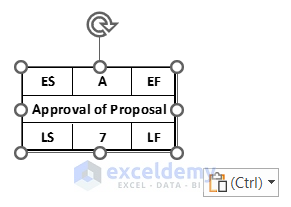
- Click on any cell beside the frozen pane.
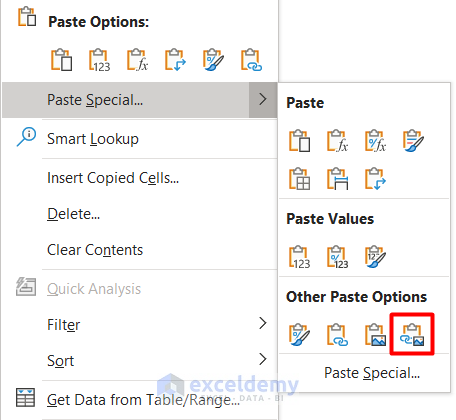
- Right-click and go to Paste Special.
- Select Linked Picture.
- You will get the cell in a picture format (see screenshot) that can be moved easily.
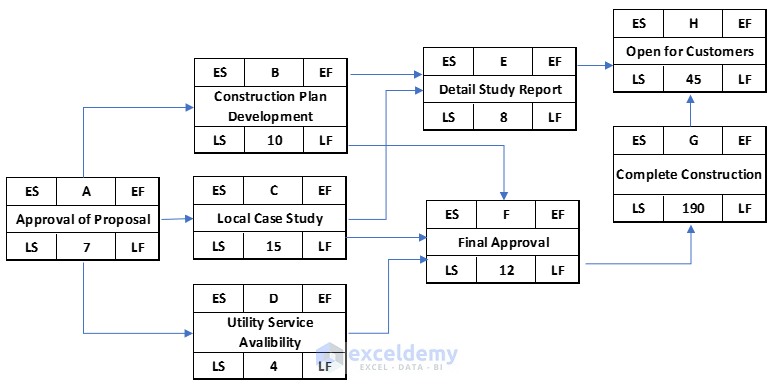
- Follow the similar process for each activity in the dataset.
- Connect them with an arrow according to the predecessor from the dataset (See screenshot).
Step 4 – Proof of Method
- Insert the MAX formula in cell B12.
=MAX(D8)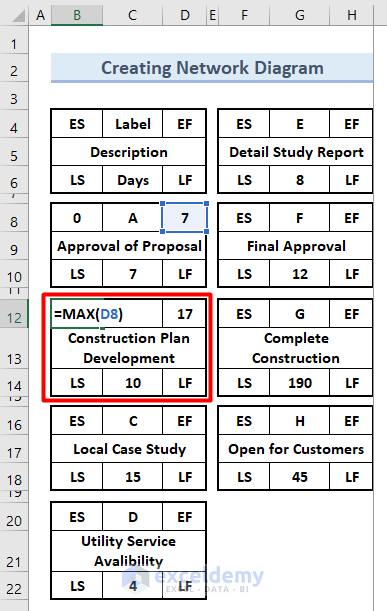
Here, the value of EF of A determines the value of ES of B, as it is the predecessor of this activity. Therefore, we used the MAX function to find the value.
- Press Enter.
- Insert the SUM function in cell D12.
=SUM(B12,C14)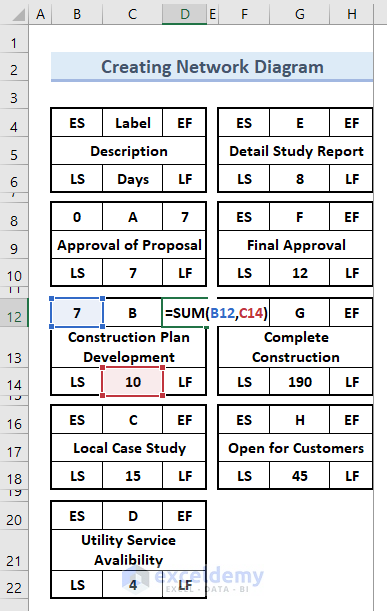
Here, the value of the ES and Days of B determines the value of EF as the summation of this specific activity. Therefore, we used the SUM function to find the value.
- Press Enter.
- You can see that the ES and EF value has changed in the network diagram.
Try these formulas to find all the values based on their predecessors. You can also change any value and see the outcome in the network diagram.
Read More: How to Draw AON Network Diagram on Excel
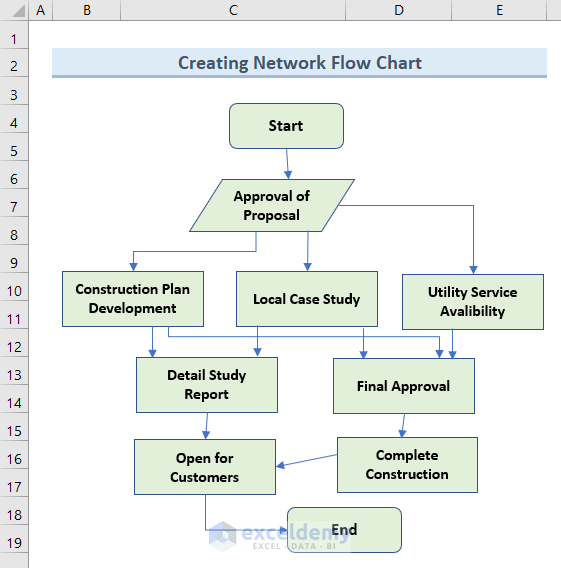
How to Create a Network Flow Chart in Excel
Another type of network diagram is an Excel flow chart. The flow chart doesn’t update if you change your dataset and must be redrew.
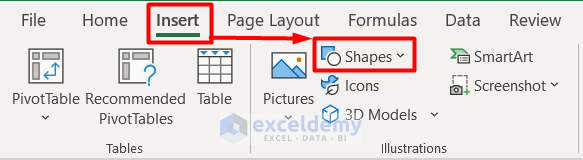
- Go to the Insert tab and select Shapes under the Illustrations group.
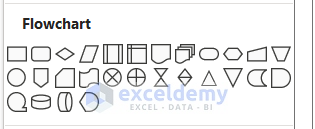
- Select a shape from it under the FlowChart section.
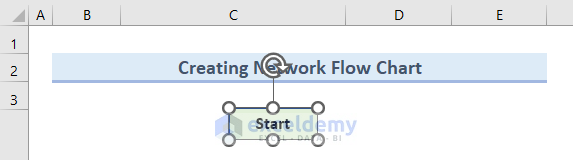
- Type Start to begin the process.
- Insert different shapes and type the activity names.
- Connect them according to their predecessors with arrows.
The final output looks like this:
Download the Practice Workbook
Related Articles
<< Go Back to Network Diagram in Excel | Learn Excel
Get FREE Advanced Excel Exercises with Solutions!

O this is awesome. It really helped me especially with my project management assignments. Currently taking up project management course.
Thank you so much.
Hello Dianne Waginauru,
You are most welcome and thanks for your appreciation. All the very best for you project management journey.
Regards
ExcelDemy