Method 1 – Percentage Change Between Two Numbers
Percentage change can be two types.
- Percentage Increase
- Percentage Decrease
When the second value i.e. the new value is greater than the first value i.e. old value, the percentage change becomes positive and it is a percentage increase. When the second value is smaller than the first value, the percentage change becomes negative which means it is a percentage decrease.
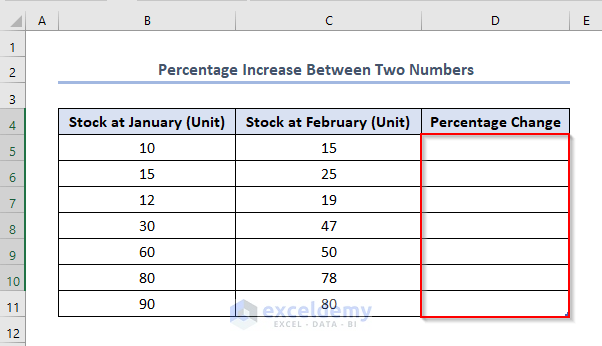
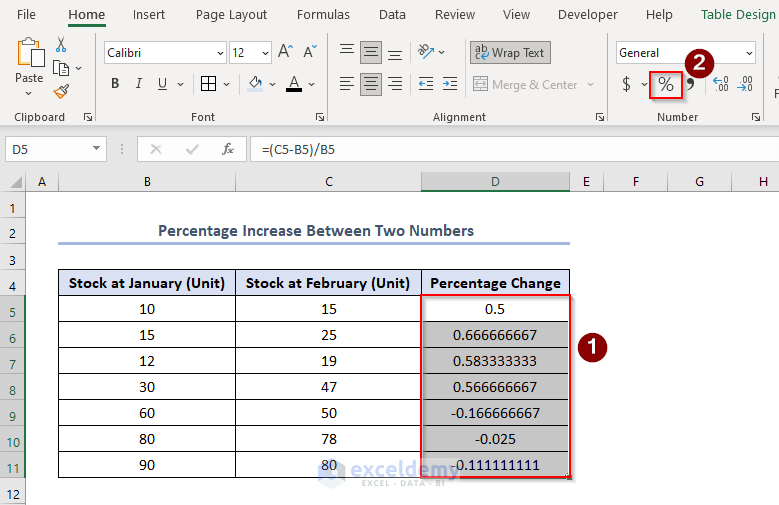
In the figure below, we’ll try to calculate the percentage change between two values in column D. The two values are Stock at January and Stock at February.
Steps:
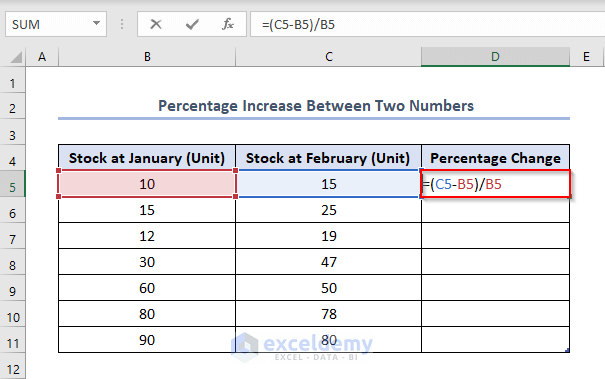
- Enter the following formula in cell D5.
=(new value-old value)/old value=(C5-B5)/B5C5 and B5 refer to the first value of Stock of January i.e. 10, and Stock of February i.e. 15 respectively.
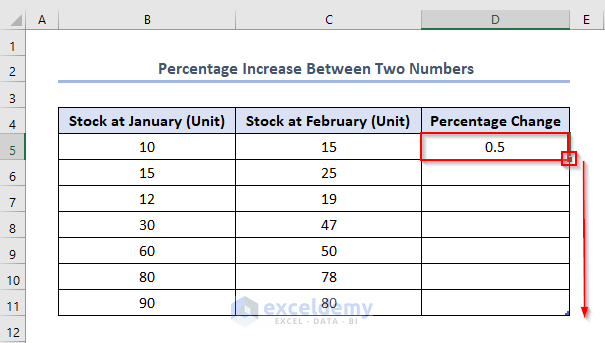
- Press ENTER to get the output as 0.5.
- Drag the Fill Handle to fill in the remaining cells.
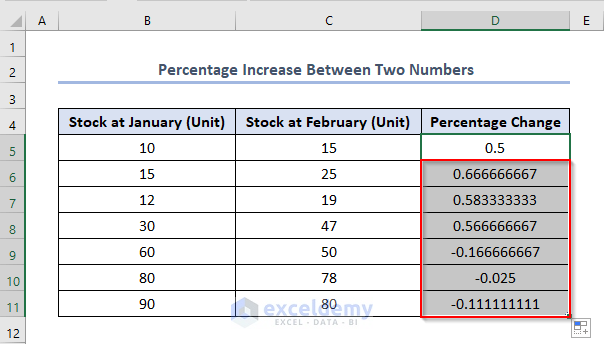
- You’ll get the output shown below.
- Select range B5:B11 > Click the Percentage Style (%) sign of the Number group command.
- The final output will look like this.
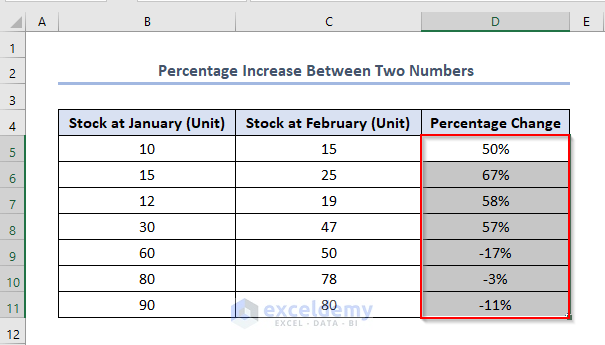
In the above image, in the 5th row, we see that the quantity of Stock at February is higher than Stock at January. That’s why we found an increase in the percentage. Similarly, the percentage is increased in the 6th, 7th, and 8th rows. On the other hand, we see that the quantity of Stock at February is lower than that of January in the 9th, 10th, and 11th rows. The percentage has decreased and this will happen for every case when the second value is lower than the first value.
Read More: How to Calculate Percentage Change with Negative Numbers in Excel
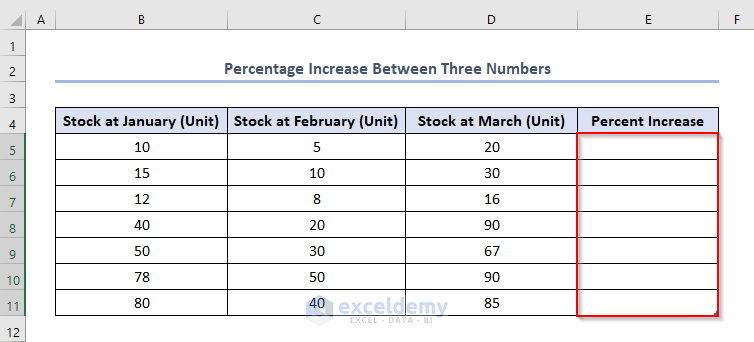
Method 2 – Percentage Change Among Three or Multiple Numbers
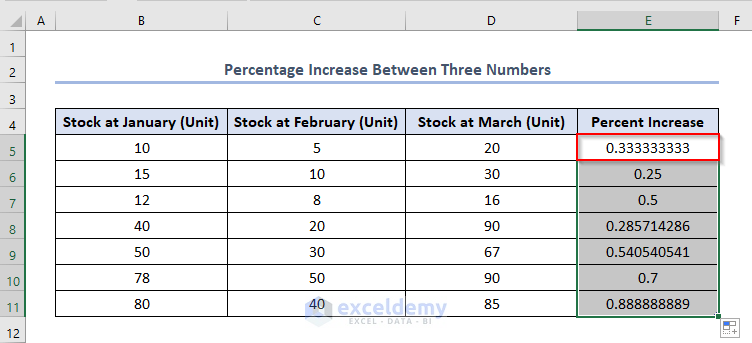
We have the following dataset where we need to calculate the percentage in column E.
The formula to calculate percentage change among three or more numbers is:
=(first value-second value)/(third value-second value)Steps:
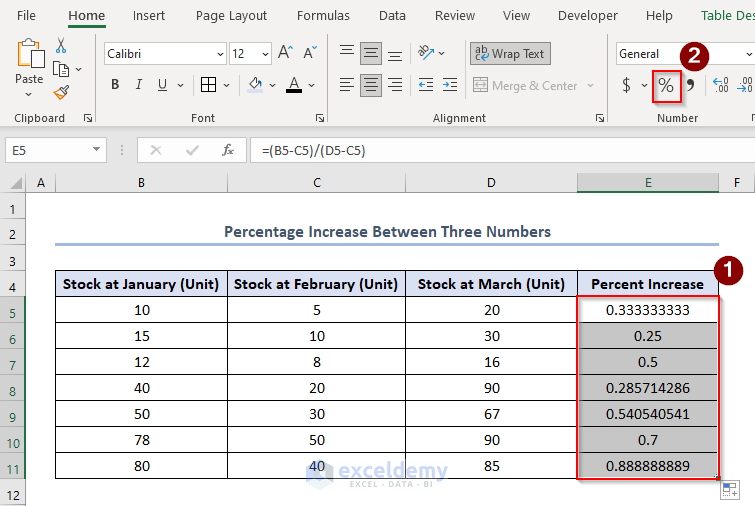
- Enter the following formula in cell E5.
=(B5-C5)/(D5-C5) A2 is the first value, which is 10, B2 is the second value which is 5 and C2 is the third value which is 20.
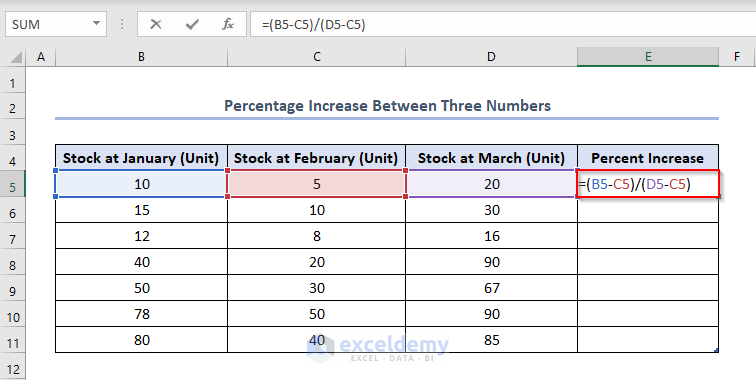
- Press ENTER and use the Fill Handle to get the output like this.
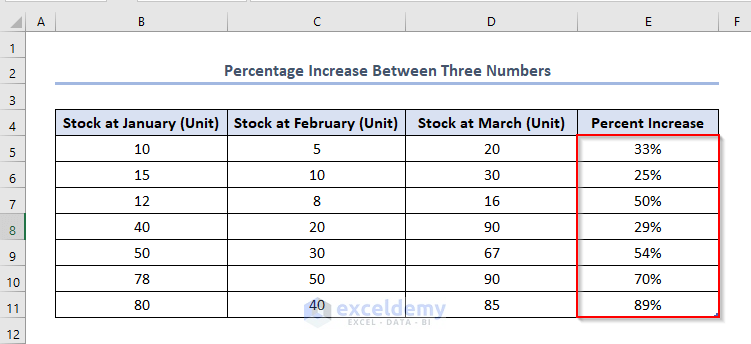
- Select the range E5:E11 > Click the Percentage Style (%) sign of the Number group command.
- You will get the percentage increase among the three numbers.
Read More: How to Show Percentage Change in Excel Graph
Further Readings
- How to Calculate Average Percentage Change in Excel
- How to Calculate Year over Year Percentage Change in Excel
- Calculate Percentage Difference Between Two Numbers in Excel
- Percentage Difference Between Two Percentages in Excel
<< Go Back to Percentage Change | Calculating Percentages | Calculate in Excel | Learn Excel
Get FREE Advanced Excel Exercises with Solutions!

Hello, How do I calculate count change and percent change with many values given?
The formula for calculating count change is simply final avalue – initial value. But my teacher want me to do it for like 10 different columns the amount of burglaries from 2000-2011. Each year has a value example year 2000 38352, 2001 32763, 2002 31275, 2003 29110, and so on. So if I were to calculate the “count change” with two numbers i know what to do but with all of this numbers I don’t know how, and then after that I have to calculate the “percent change” for all these numbers. Do you know how this is done. Maybe I am just very confused.thank you
Dear Nelly,
Actually, percentage change mostly fits between two numbers. There is no specific formula to calculate percentage change among multiple numbers. Rather, when we face percentage change calculation, it means we are simply asked for the percentage change between the first number and the last number. In this case, the formula is.
=((Final Value – Initial Value)/Initial Value)*100
As your teacher has given you 10 different columns of values, you can calculate percentage change for each 2 individual columns and finally find a mean value of percentage change.
This is like.
=((2nd Value – First Value)/First Value)*100
Then,
=((3rd Value – 2nd Value)/2nd Value)*100
Similarly, following the same formula find all the individual percentage change. For 10 columns you will find 9 individual percentage change.
Finally, to find the mean.
=(Percentage Change of (Step 1 + Step 2 + …….+ Step 9))/ 9
Similarly, this statement is true for calculating count.
Regards,
Towhid
Excel & VBA Content Developer
ExcelDemy