What Is Z Score?
In statistics, the z score represents the standard deviation from the population for a particular data point. This measure tells us how far a specific value is from the mean of a set in relation to its standard deviation (standard deviation is the RMS value of all the different points and mean). The mathematical formula for the z score is
Z= z score
X=observed value
x̅= mean value
σ = standard deviation
What Is an Outlier?
Outliers are values that are significantly different from other values in a dataset. An outlier is a value that is much higher or lower than the mean and median of the dataset. In an Excel graph, you can consider the data points which remain far away from the other data points as outliers. For instance, consider a scenario where you have total points scored by 5 different players in the NBA season. The scored points are 1600, 1400, 300, and 1500. If you plot a graph in Excel, you will see that point 300 lies far away from the others. So, it is the outlier.
An outlier is considered to have a z score value outside the range of 3 to -3.
How to Find Outliers Using Z Score in Excel: Step-by-Step Procedure
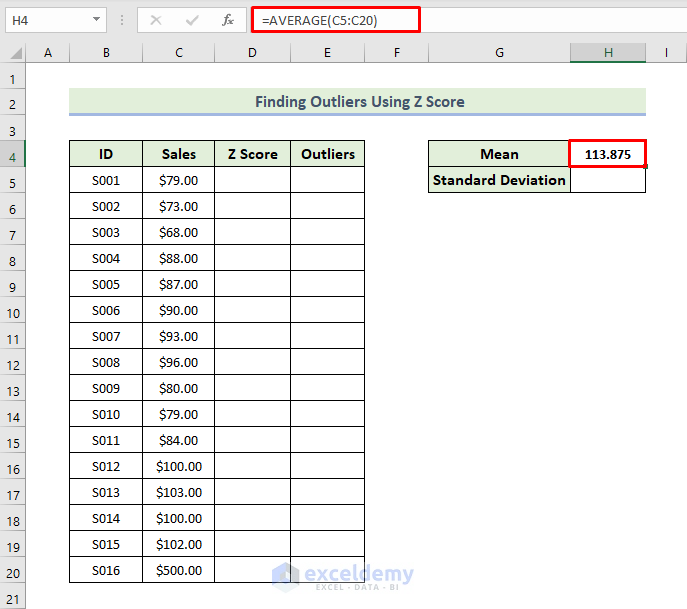
Step 1 – Calculate the Mean
- Our dataset contains values in the range C5:C20 that we’ll analyze.
- Insert the following formula in a cell. We chose H4.
=AVERAGE(C5:C20)
- Press Enter.
Read More: How to Find Outliers with Standard Deviation in Excel
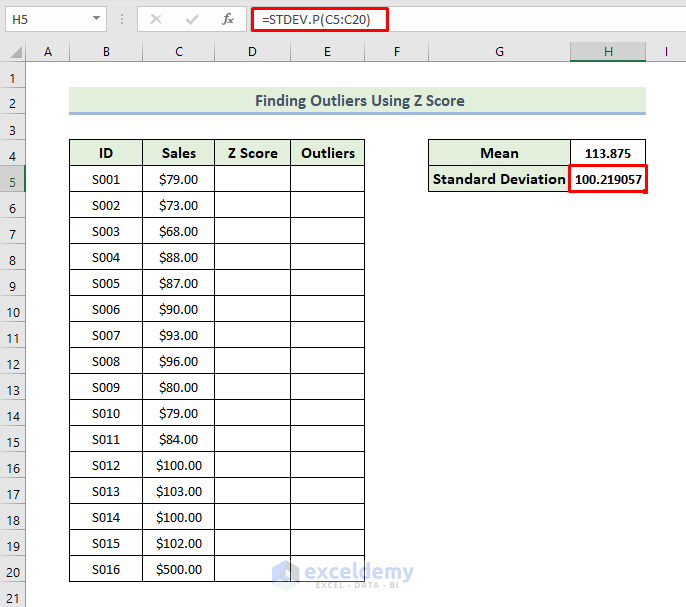
Step 2 – Estimate Standard Deviation
- Insert the following formula in cell H5.
=STDEV.P(C5:C20)
- Press Enter.
Read More: How to Calculate Outliers in Excel
Step 3 – Evaluate Z Scores
- Use the following formula in cell D5.
=(C5-$H$4)/$H$5
- Press Enter.
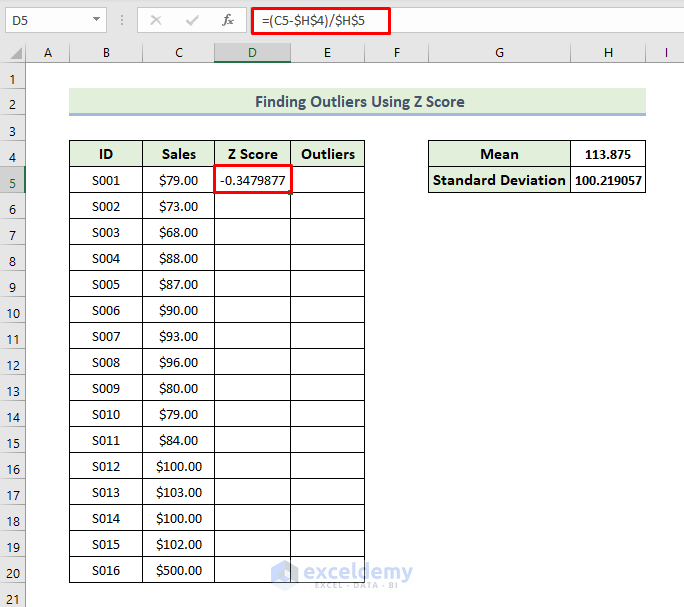
- Drag the Fill Handle icon down to fill out the rest of the cells in the column with the formula.
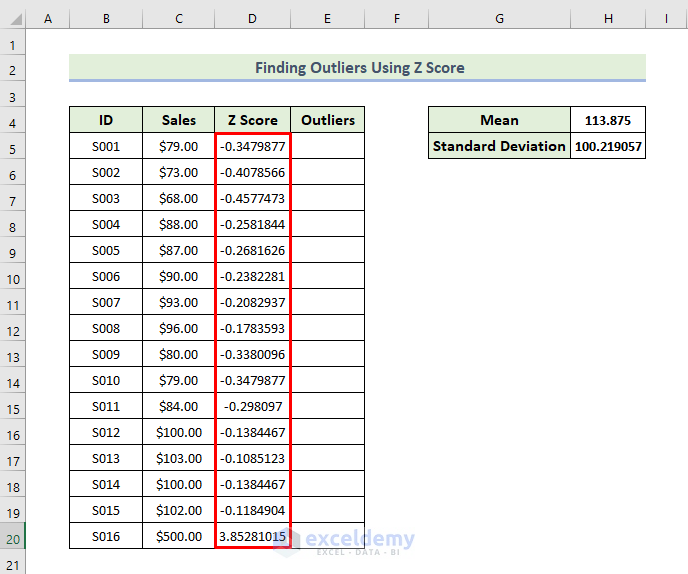
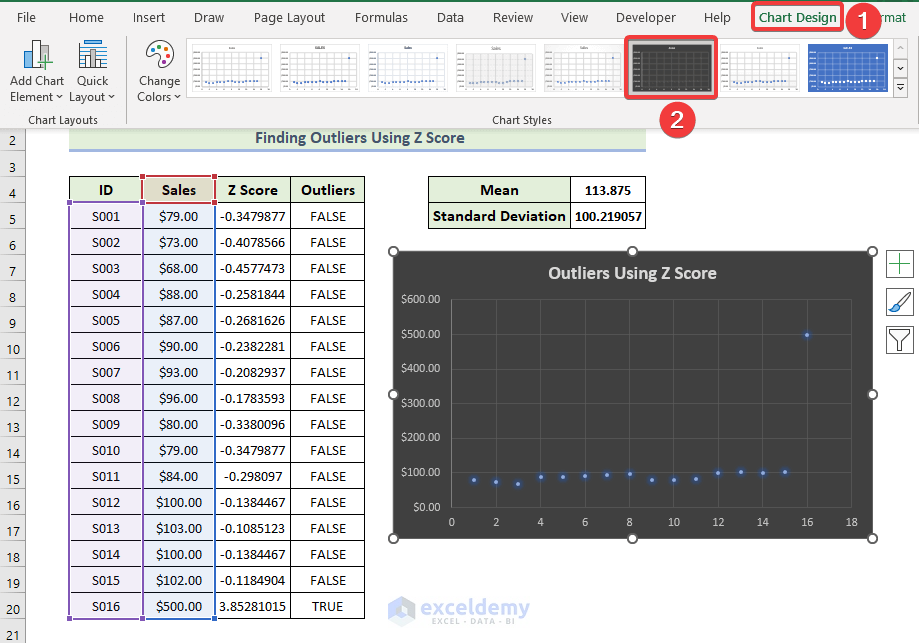
- The mean value is 113.875 and the standard deviation is 100.21. If we consider the specific value of $79, the z score for this value is -0.347 which means $79 is 0.347 standard deviations below the mean or average value.
- When the value is $500, we get the z score is 3.85. That means $500 is 3.85 standard deviations above the mean value.
Read More: How to Find Outliers in Regression Analysis in Excel
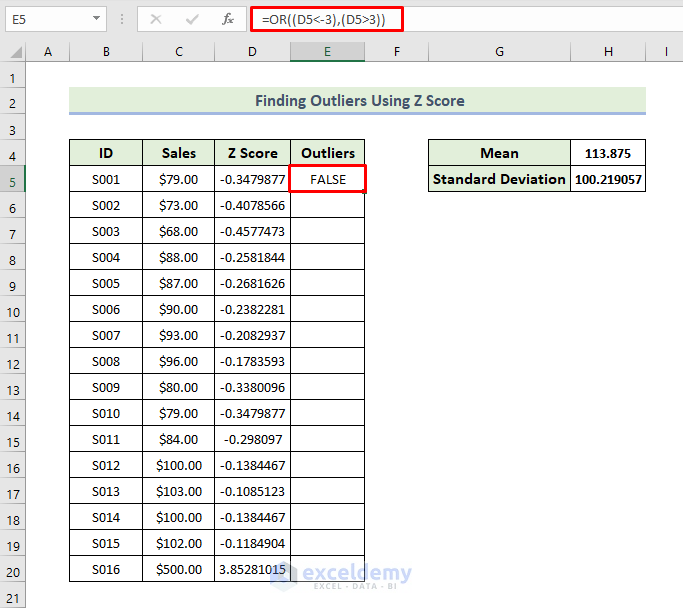
Step 4 – Find the Outliers
- Use the following formula in cell E5.
=OR((D5<-3),(D5>3))
- Press Enter.
- Drag the Fill Handle icon to fill out the rest of the cells in the column with the formula.
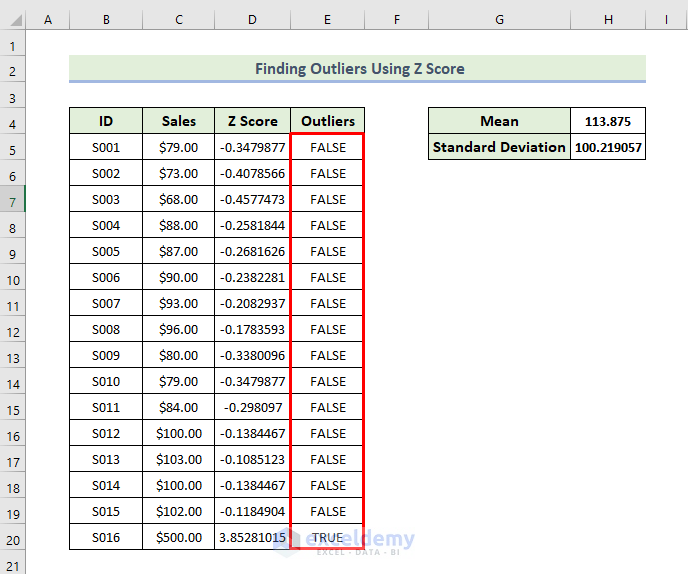
From the above dataset, we can see only one id’s z score is above the value of 3. That’s why we only get one outlier.
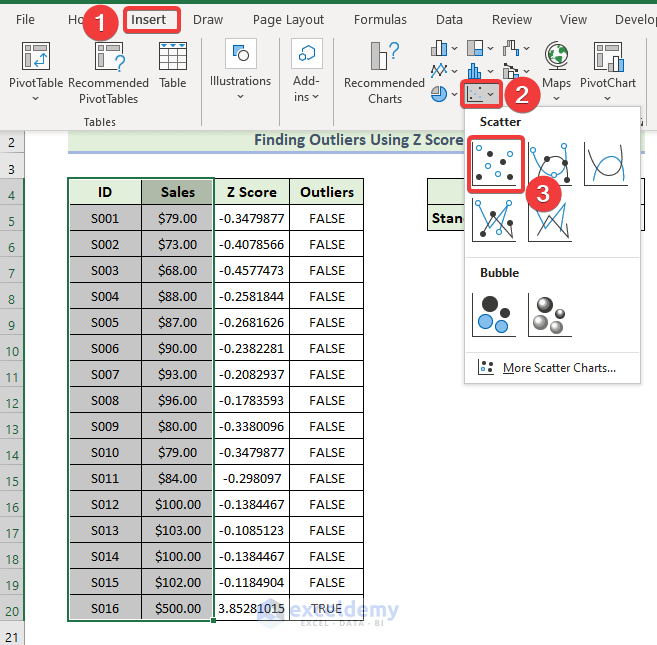
We are going to show outliers using a Scatter chart:
- Select the range of the cells C5:D20.
- Go to the Insert tab.
- Select Insert Scatter (X, Y) or Bubble Chart and select Scatter.
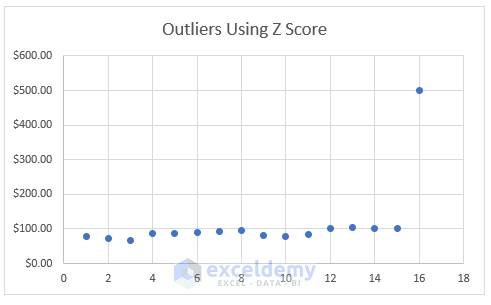
- You will get the following chart.
- Select Chart Design and then select your desired option from the Chart Styles group.
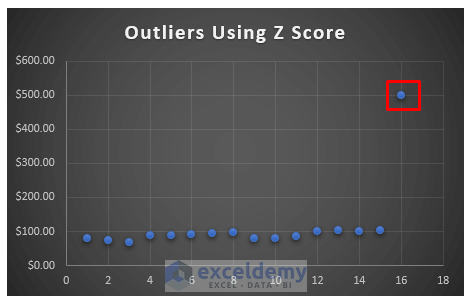
- We get the following Scatter chart.
- Notice that the value with ID 16 is away from the others. This is the outlier.
Download the Practice Workbook
Related Articles
<< Go Back to Outliers in Excel | Excel for Statistics | Learn Excel
Get FREE Advanced Excel Exercises with Solutions!
