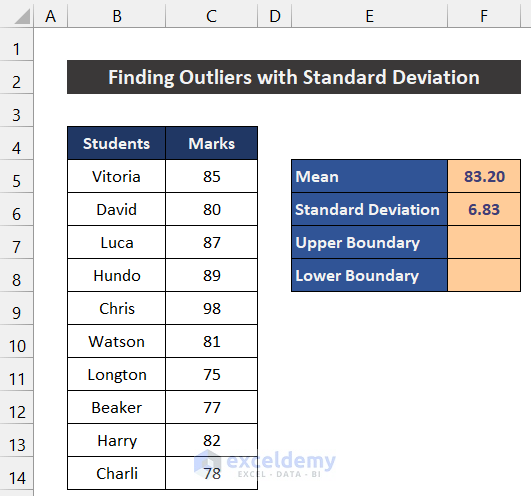
Method 1 – Estimate Mean of Dataset
- Select cell E5 and entitle the cell as Mean.
- Write down the following formula into cell F5.
=AVERAGE(C5:C14)
- Press Enter.
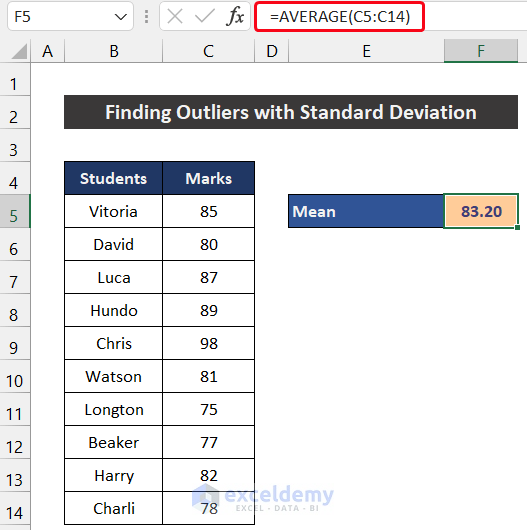
- You will get the mean value of our dataset.
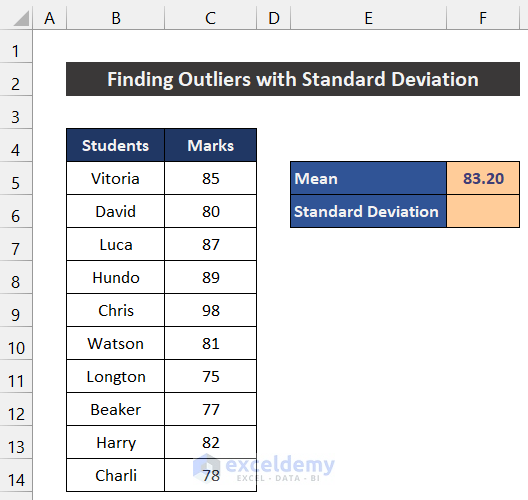
Method 2 – Determine Standard Deviation
- Select cell E6.
- Entitle the cell as Standard Deviation.
- Write down the following formula into cell F6.
=STDEV.S(C5:C14)
- Press Enter.
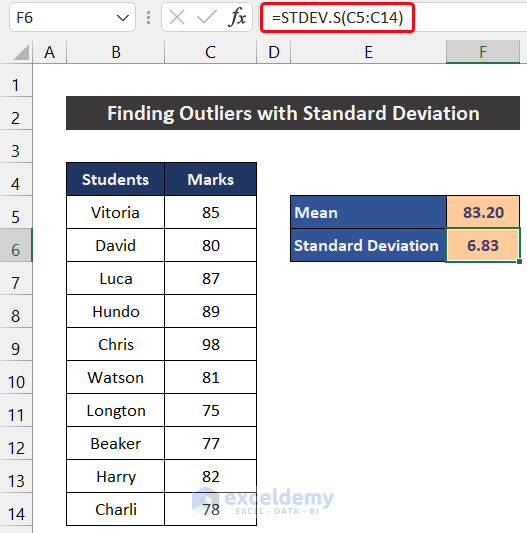
- Get the value of the standard deviation of our dataset.
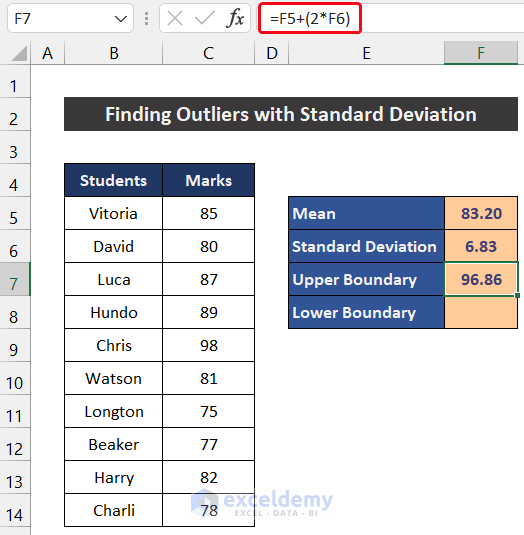
Method 3 – Evaluate Upper and Lower Boundary
- At the beginning of this step, entitle the cells E7 and E8 as Upper Boundary and Lower Boundary respectively.
- Select cell F7 and write down the following formula into cell F7.
=F5+(2*F6)
- Press Enter.
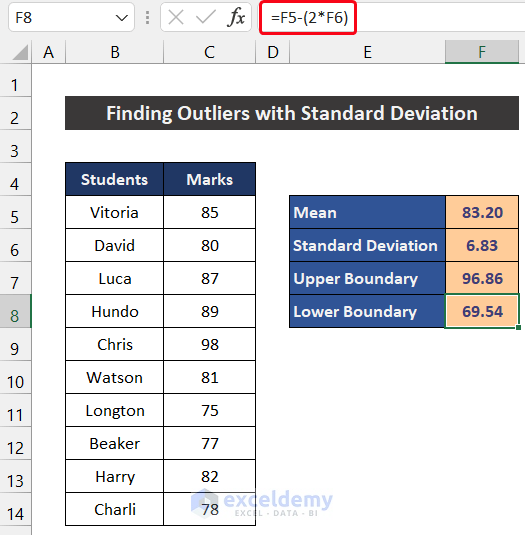
- In cell F8, write down the following formula.
=F5-(2*F6)
- Press Enter to get the value.
Method 4 – Find Outliers from Dataset
- Insert a column between columns C and D and entitle the column as Outlier.
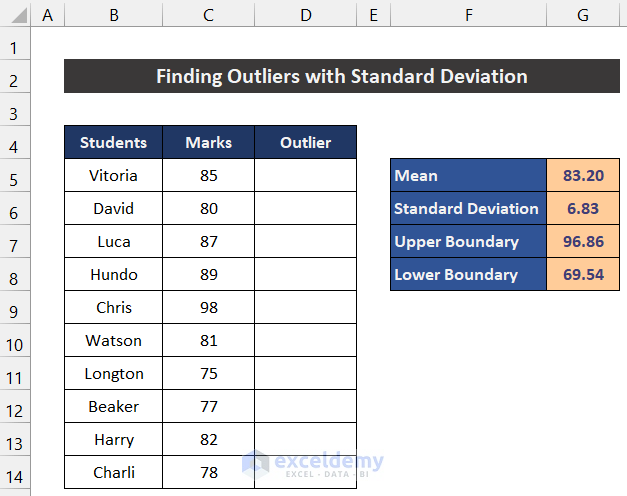
- In cell D5, write down the following formula in the cell. Insert the Absolute Cell Reference sign for the cells G7 and G8.
=OR((C5>$G$7),C5<$G$8)
- Press Enter.
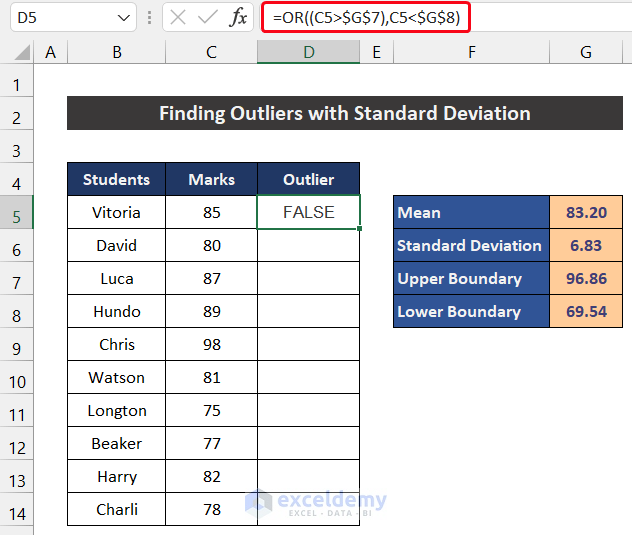
- Double-click on the Fill Handle icon to copy the formula up to cell D14.
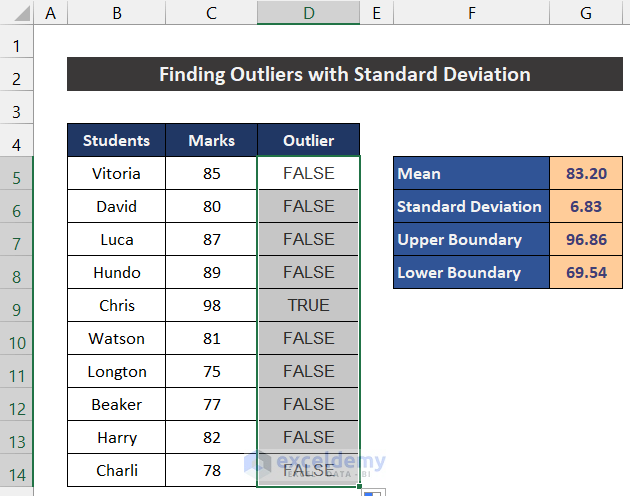
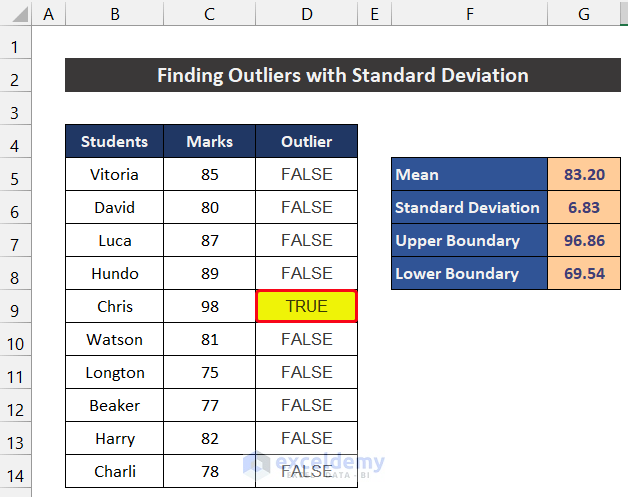
- You will get the decision from Excel, and the result shows us whether the value is an outlier or not.
We have finished the final step to find outliers with standard deviation in Excel.
Interpretation of the Result
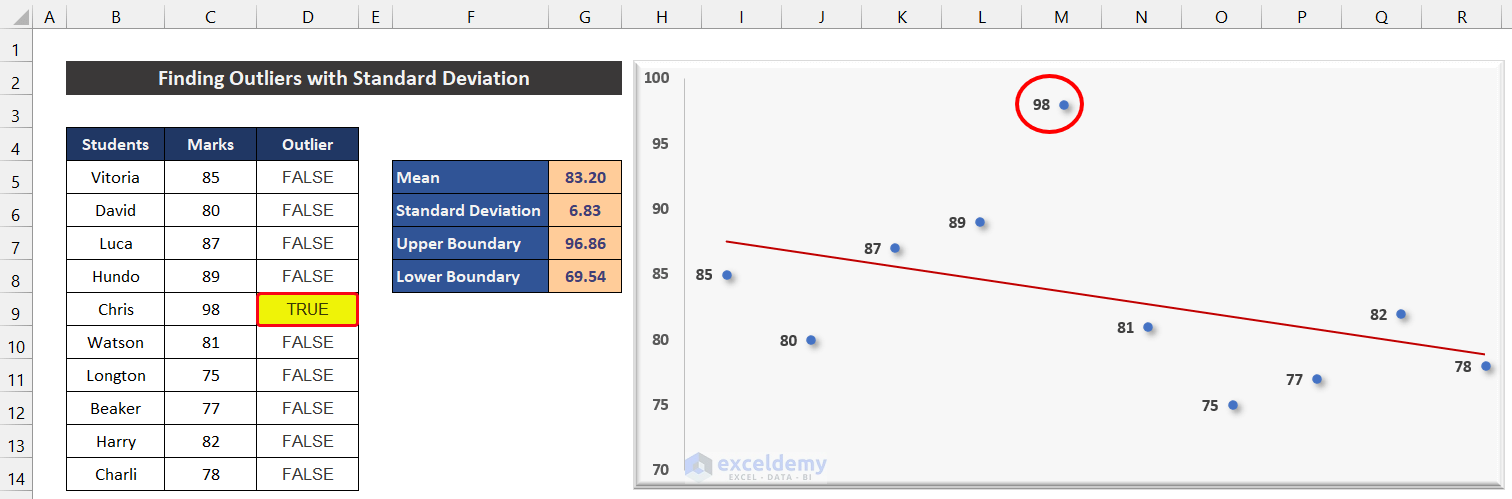
From the result of column D, we get the decision whether the value is an outlier or not. If you notice carefully, all the entities of that column are FALSE, except cell D9. The decision for cell D9 is TRUE. Now, if you look at column C, the value of corresponding cell C9 is 98, which is higher than the rest of the data. Our other values are in the range of 75-89. So, we can acknowledge that the value of cell C9 is an outlier to the other data.
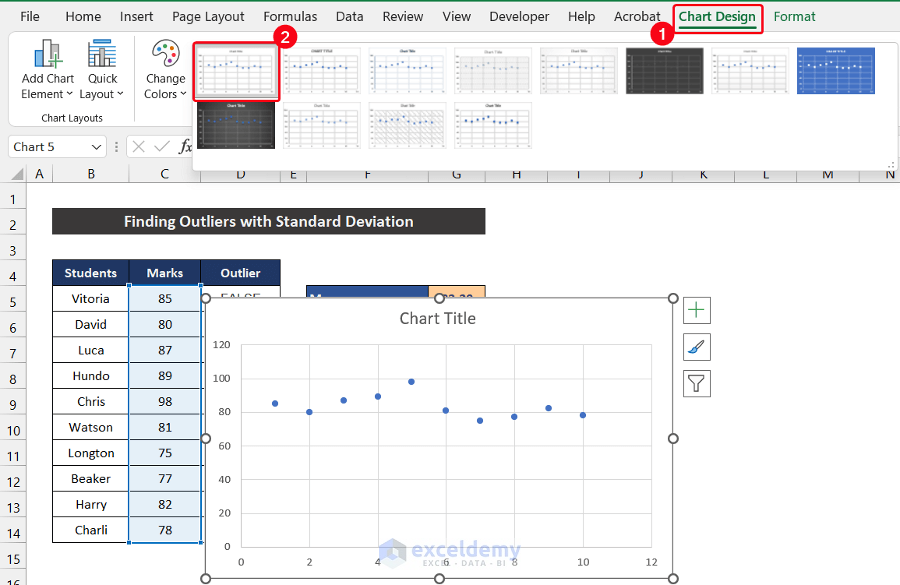
Method 5 – Insert Chart to Visualize Output
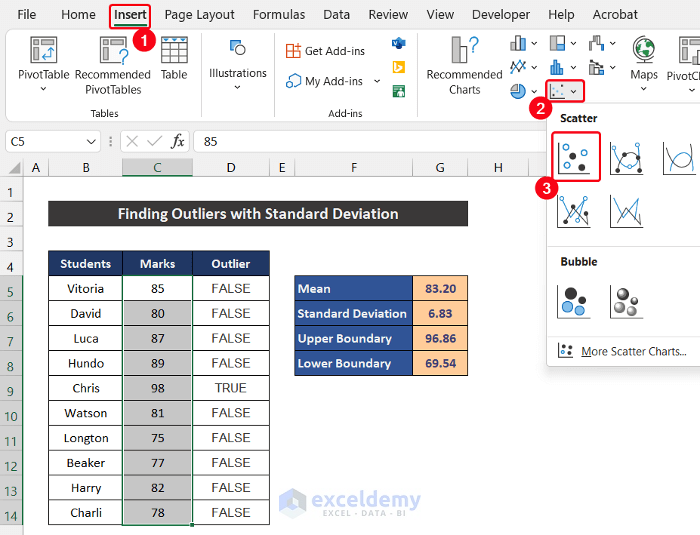
- Select the range of cells C5:C14.
- In the Insert tab, click on the drop-down arrow of the Insert Scatter (X, Y) or Bubble Chart from the Charts group.
- Choose the Scatter chart from the Scatter section.
- The chart will appear in front of you.
- Modify the chart according to your desire from the Chart Design and Format tab. We kept the default style for our chart.
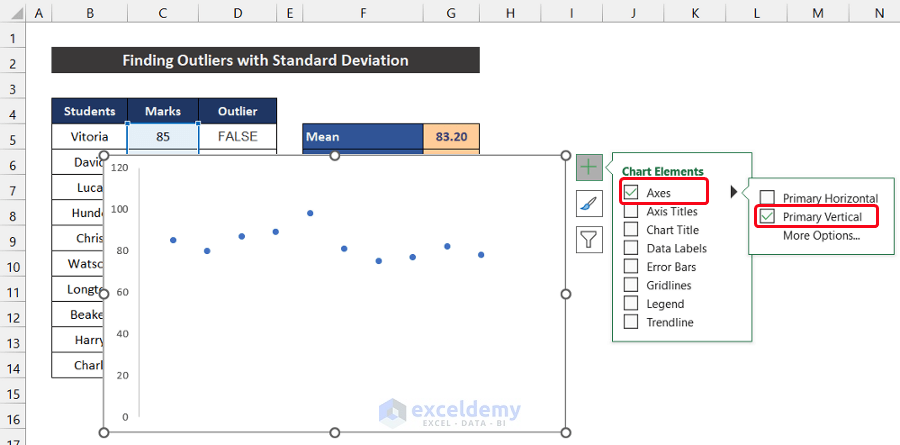
- Click on the Chart Elements icon and check only Primary Vertical from the Axes option.
- Check the Data Labels on the Left and the Trendline option.
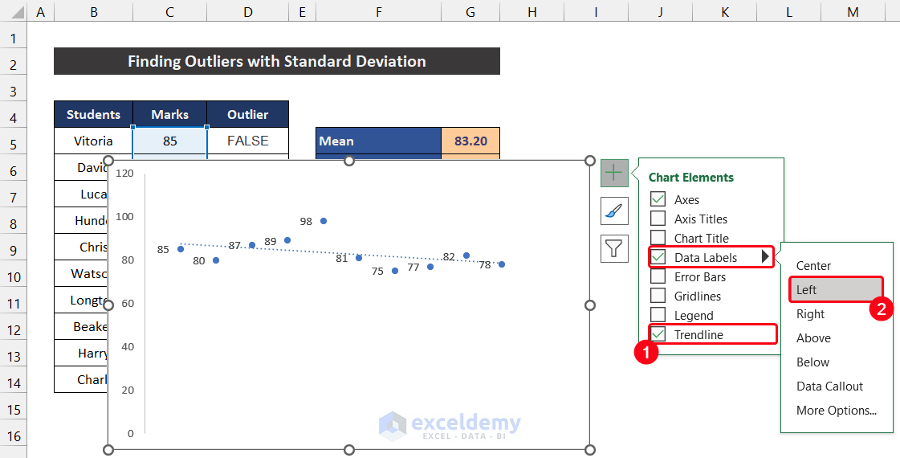
- Our dataset may notice that all of our data is above 74. We don’t need the scaling of 0-74 in the vertical axis.
- To eliminate it, double-click on the scale of the vertical axis.
- A side window called Format Axis will appear.
- In the Axis Options tab, reset the Minimum value from 0 to 70 in the Bound section. You will see the scale below 70 is disappeared.

- Notice that all the values of our dataset are close to our trendline, except 98. This value is much away from the trendline.
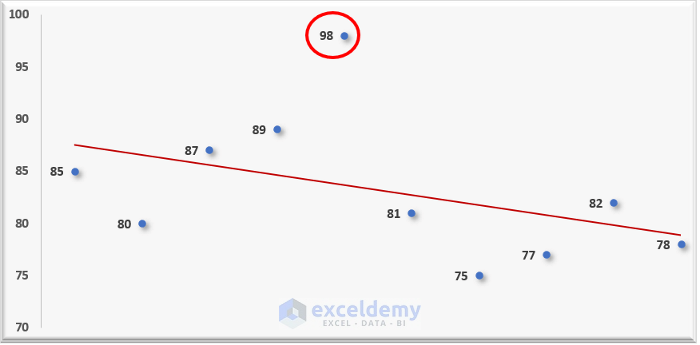
- You can accept that this value is the outlier of our dataset, and our previous formula result also mentioned it.
Download Practice Workbook
Download this practice workbook for practice while you are reading this article.
Related Articles
<< Go Back to Outliers in Excel | Excel for Statistics | Learn Excel
Get FREE Advanced Excel Exercises with Solutions!
