This is an overview.
How to Add Color Scales in Excel
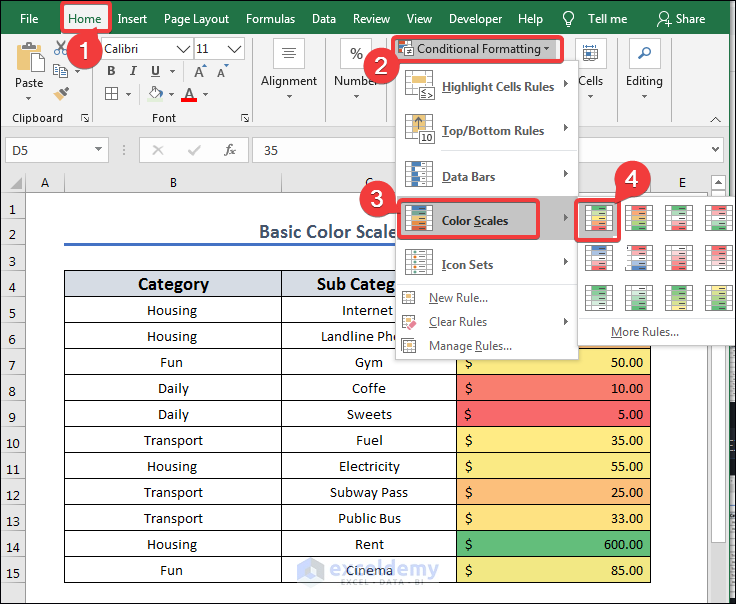
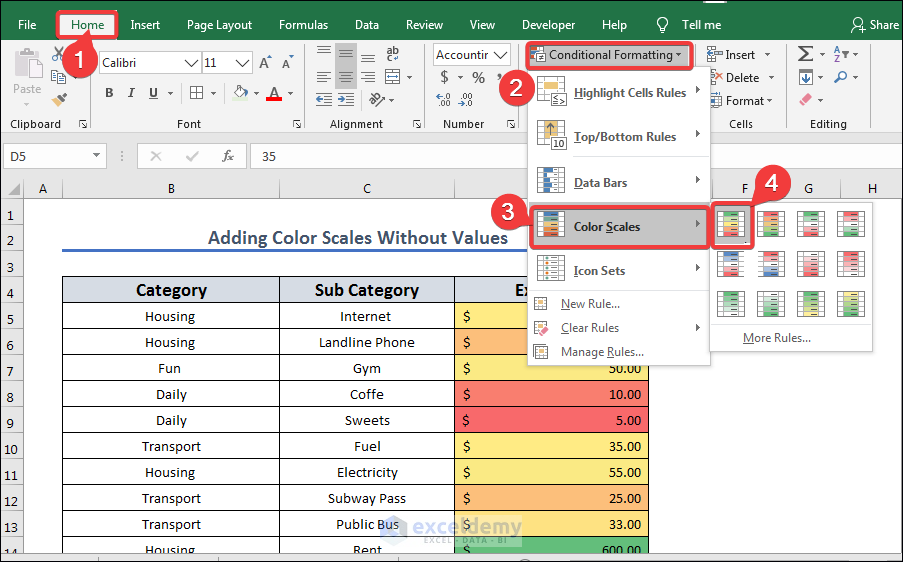
- Select the column.
- Go to Home>>Conditional Formatting>>Color Scales and Select a Color Scale.
Issues with Adding Color Scales Based on Text Values in Excel
You can only use color scales with numbers. For texts, use the conditional formatting.
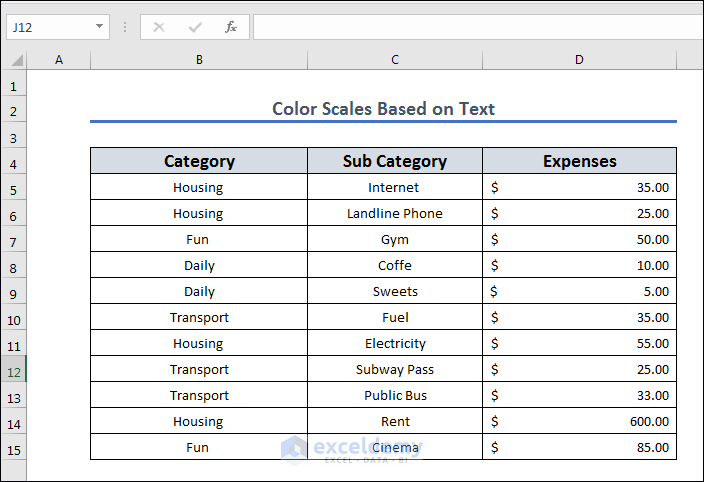
This is the sample dataset.
Example 1 – Color Scales Based on a Unique Text
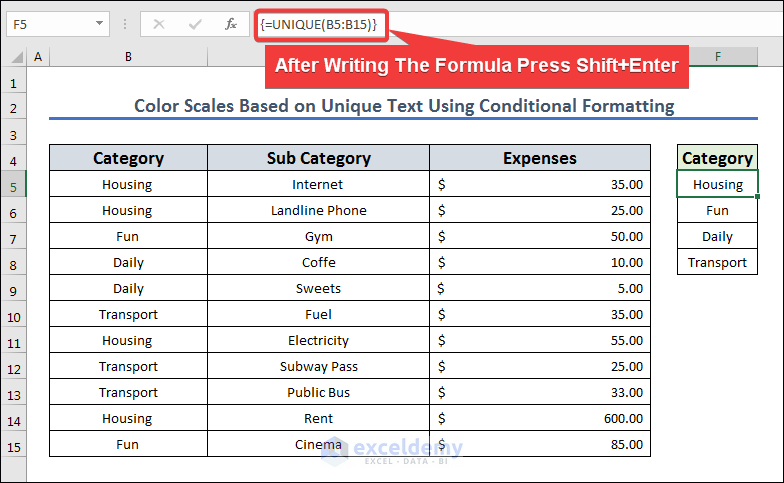
- Use the following formula:
=UNIQUE(B5:B15)- Press Shift+Enter.
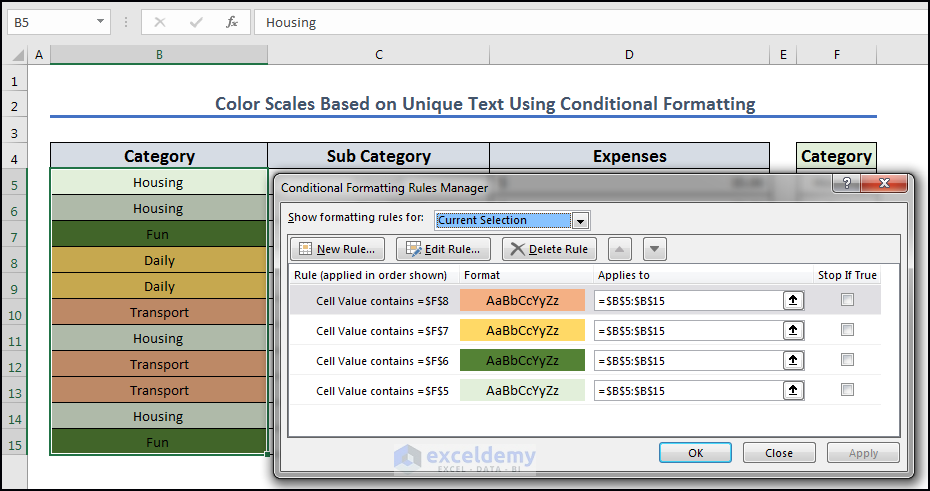
- Select the “Category” column and select Conditional Formatting.
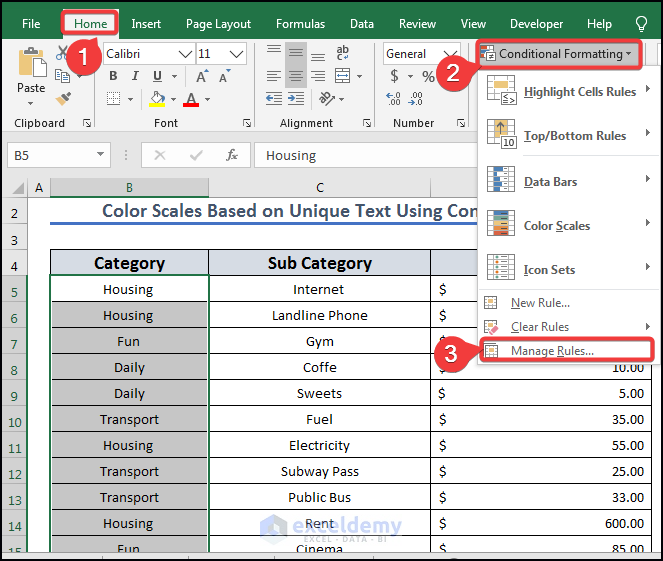
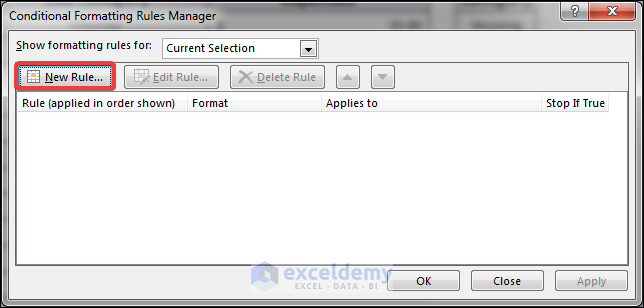
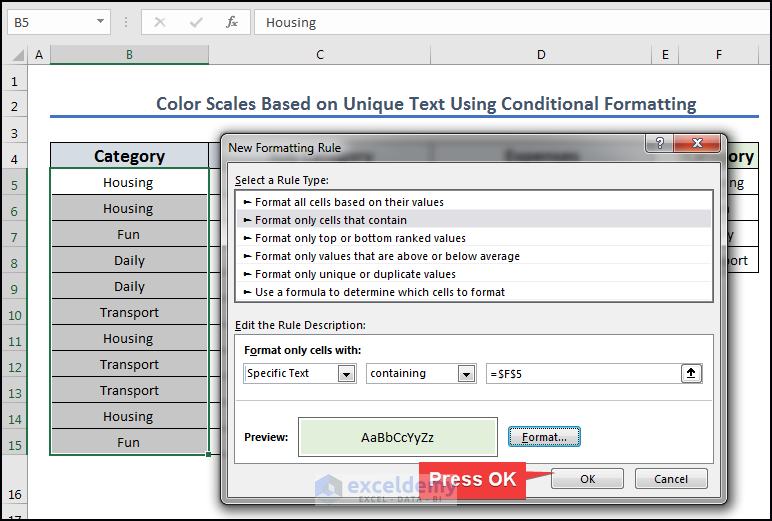
- Select New Rule.
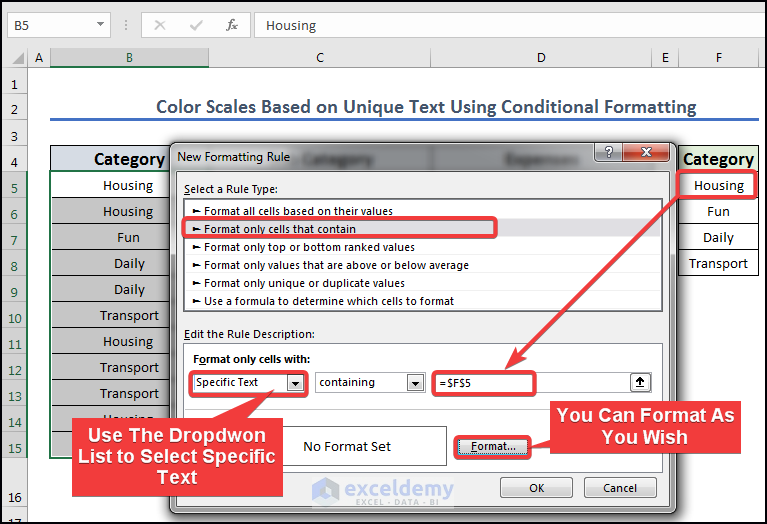
- Use the formula:
=$F$5=$B5:$B15F5 is the unique value “Housing” and it will change the format when text in $B5:$B15 equals its value.
- In the Format Cells box, select light green to fill the cell.
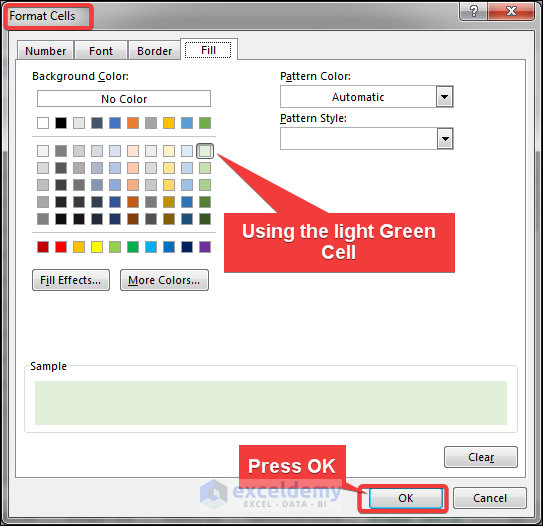
- Click OK in both Format Cells and New Formatting Rule.
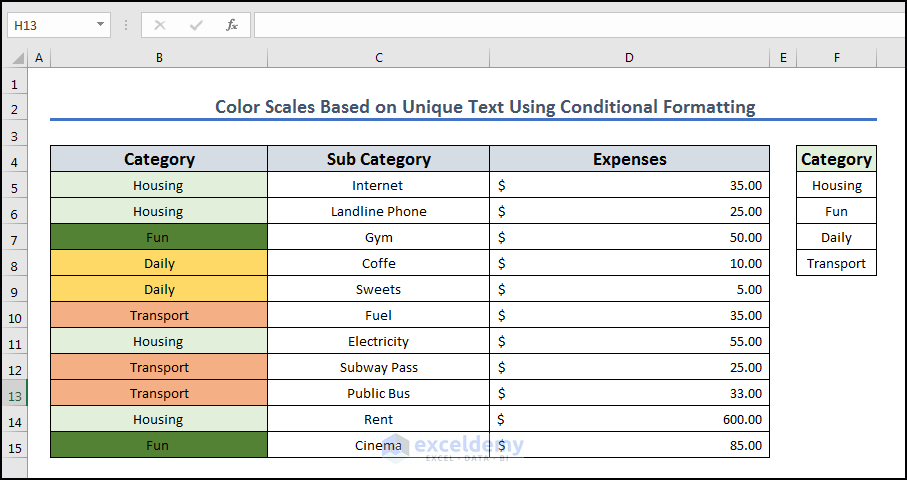
This is the output.
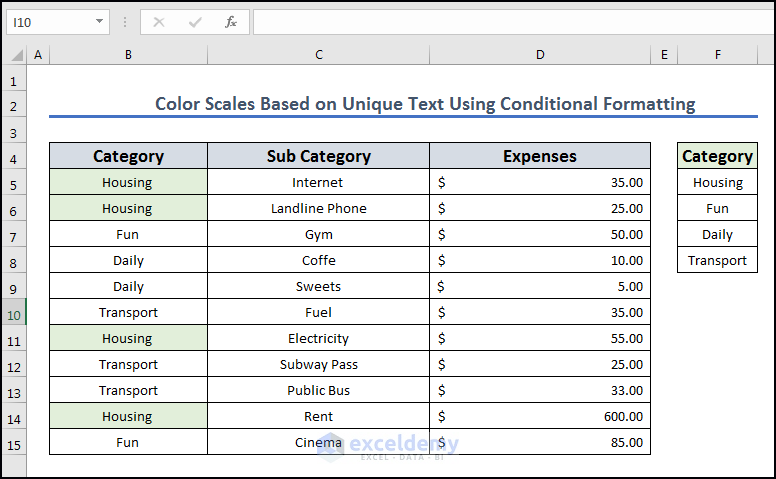
- Create individual rules for each unique category.

The whole dataset displays color scales based on text.
Read More: Color Scale Per Row with Conditional Formatting in Excel
Example 2 – Color Scales Based on Text Length
- Select the Category column and select Conditional Formatting.
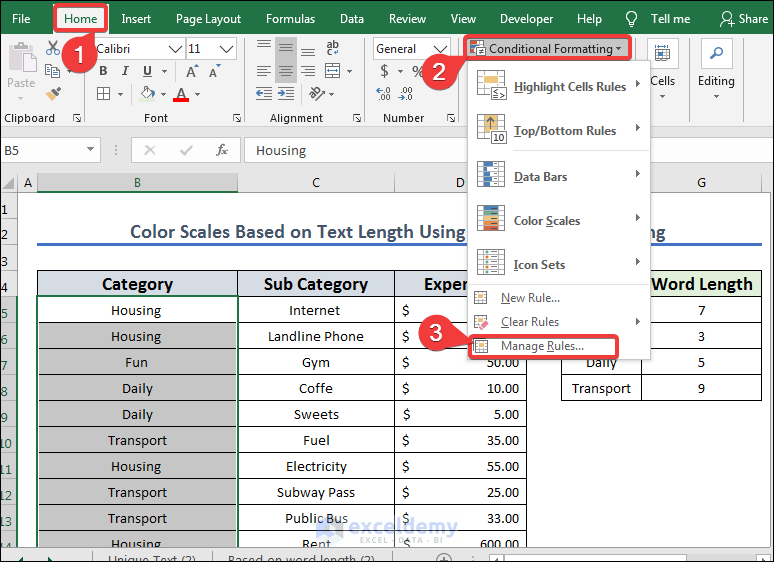
- Select New Rule.
- Enter the following condition for the length.
=LEN($B5:$B15)=9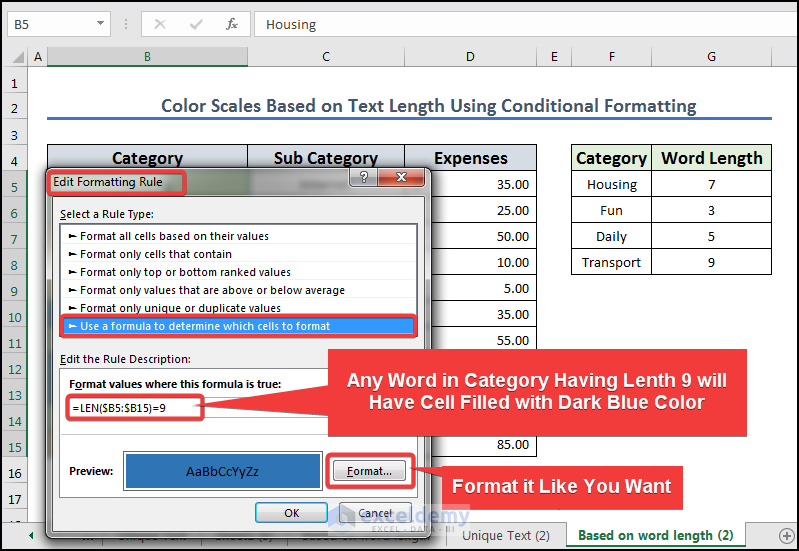
- Select dark blue in Fill.
- Create individual length formulas in New Formula.
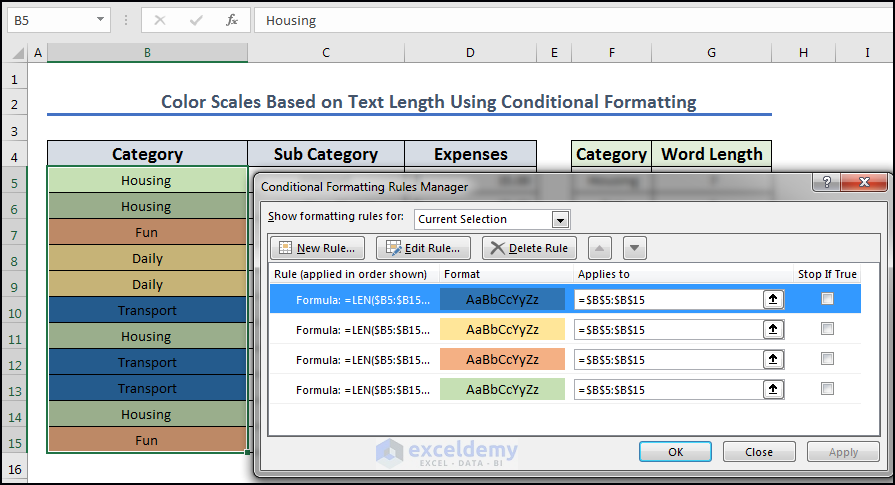
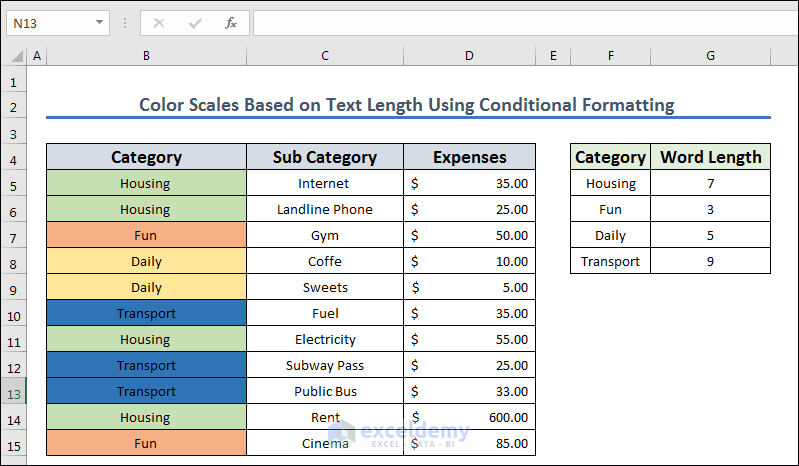
This is the output.
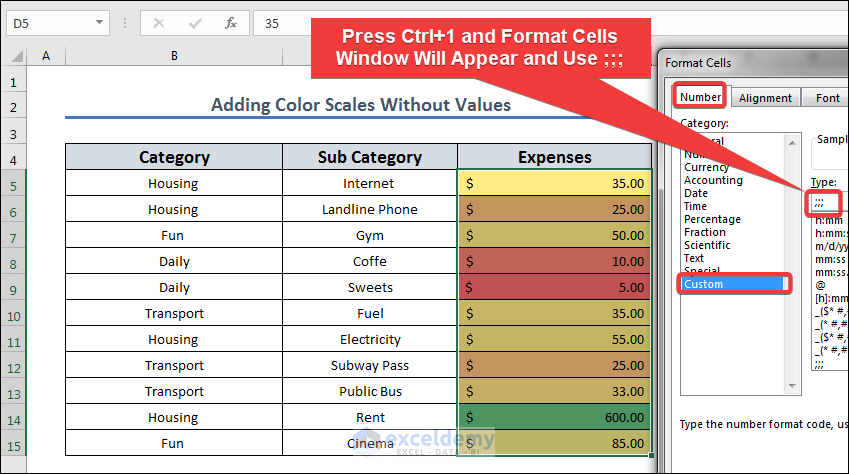
How to Add Color Scales Without Values in Excel
- Press Ctrl+1 to open Format cells.
- Select Number>>Custom>>Type and insert ;;; to hide all data in the column.
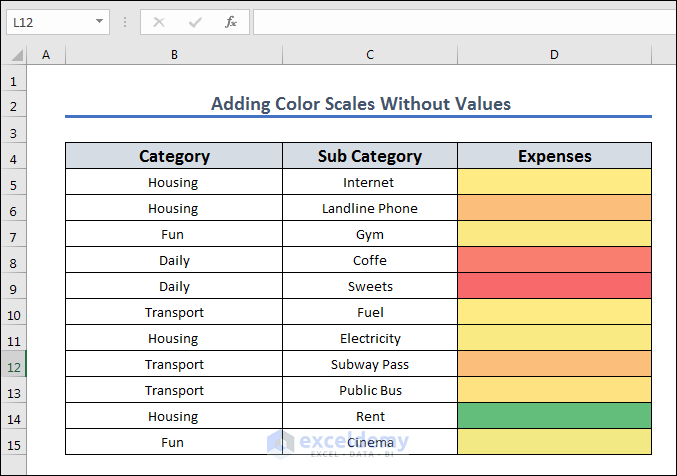
- This is the output.
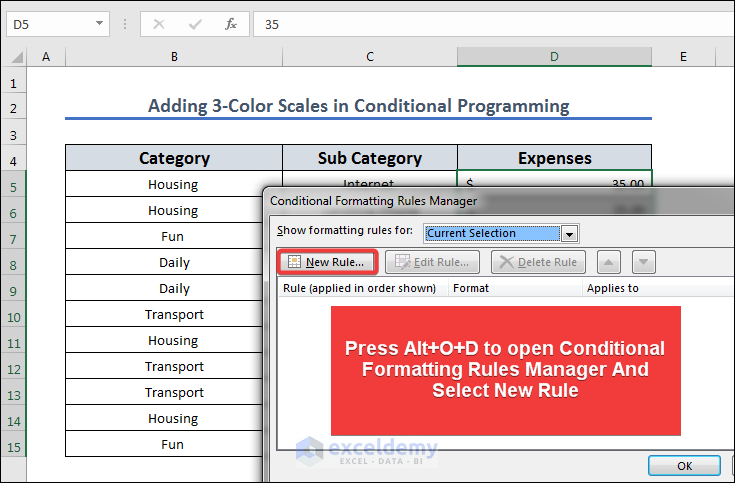
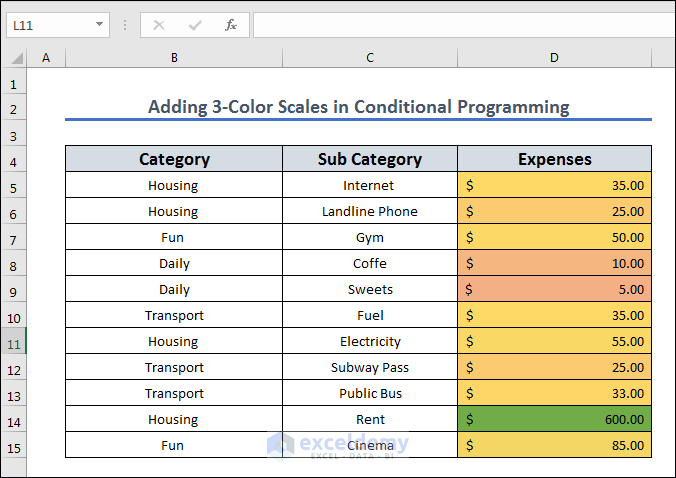
How to Add 3-Color Scale in Conditional Formatting
- Select the expenses column and press Alt+O+D to open the Conditional Formatting Rules Manager.
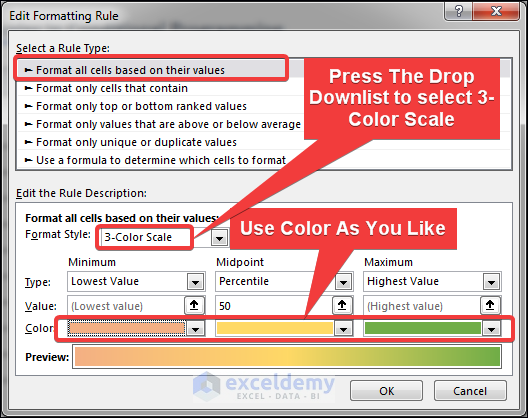
- Select Format all cells based on their values and click the drop-down button to select 3-Color Scale.
- Choose a color set.
This is the output.
Read More: Conditional Formatting with 3 Color Scale in Excel Formula
Frequently Asked Question
Q: In Excel, can I make my own unique color swatches for text values?
A: Custom color scales for text values can be made in Excel. Select “More Rules” at the bottom of the dropdown menu after choosing “Color Scales” in the Conditional Formatting menu. Create your own rules.
Q: Can I use color gradations on individual words rather than the entire cell?
A: The Excel Color Scale option only applies to whole cells. To apply formatting to a specific text within a cell, utilize Conditional Formatting.
Download Practice Workbook
Download the Excel workbook.
Related Articles
- How to Use 4 Color Scale Conditional Formatting in Excel
- How to Use Conditional Formatting with 5 Color Scale in Excel
- Excel Conditional Formatting Color Scale Based on Another Cell
<< Go Back to Conditional Formatting | Learn Excel
Get FREE Advanced Excel Exercises with Solutions!
