
Power BI is an excellent platform for building interactive, visually rich reports. However, if your audience — especially those comfortable with Excel — wants to dig deeper into the numbers themselves, you can create robust Power BI reports while still allowing users to explore the same dataset in Excel without compromising data security.
In this tutorial, we’ll show how to build a Power BI report and let users explore in Excel.
Step 1: Build and Publish Your Power BI Report
To let users explore in Excel, you will need to build a report in Power BI first. A well-structured Power BI report involves importing data, transforming it, modeling it, and then building visuals.
1.1. Import Your Data
- Open Power BI Desktop
- Go to the Home tab >> select Get Data
- Select your data source (Excel, SQL Server, SharePoint, CSV, etc.)
- Click “Load” to import the data directly, or select “Transform Data” to open Power Query for data cleaning

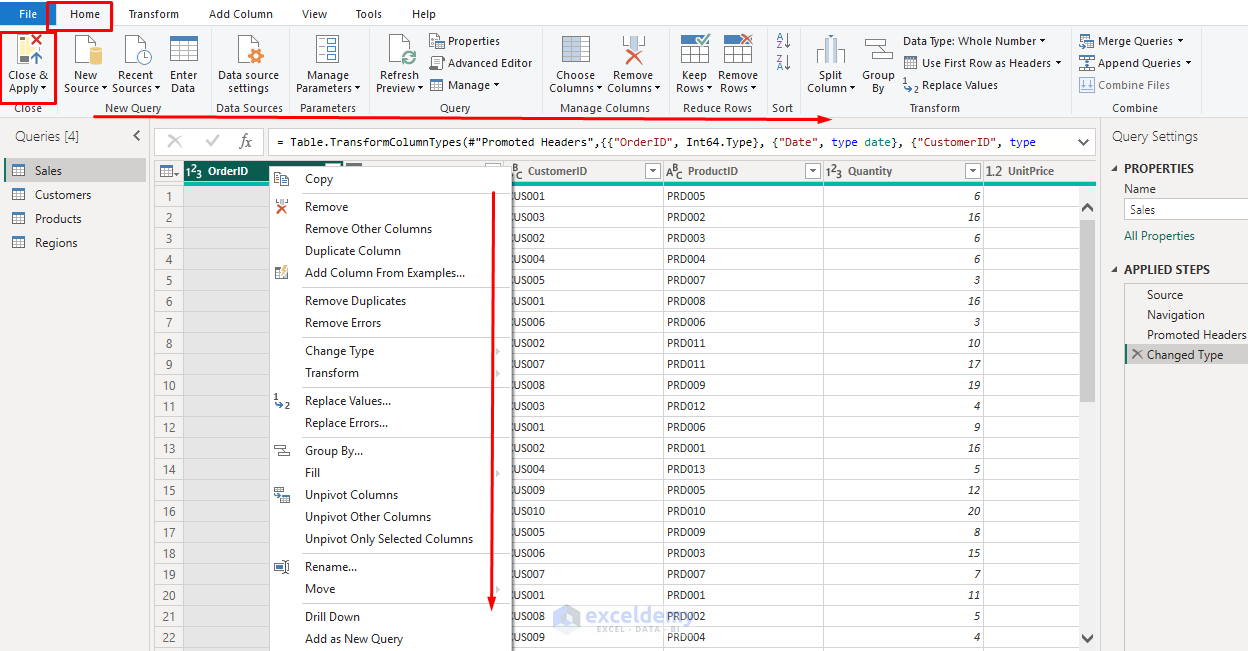
1.2. Transform & Clean Data in Power Query
In the Power Query Editor:
- Remove unnecessary columns
- Right-click the column header >> select Remove
- Rename columns to be clear and business-friendly
- Change data types (e.g., Date, Whole Number, Currency)
- Create calculated columns or custom transformations
- Filter out unwanted rows (e.g., blanks, errors)
- Once done, click Close & Apply
Tip: Clean data in Power BI so Excel users don’t have to clean it later.
1.3. Create the Data Model
If you have multiple datasets, you can use Model View to create relationships.
- Power BI can automatically detect and create relationships

- Or define relationships between tables manually
- Drag fields between tables or use Manage Relationships
- Apply Row-Level Security (RLS) so different users see different subsets of data

1.4. Create DAX Measures
Power BI measures are powerful, and you can perform time intelligence calculations easily.
Create a Date Table:
To create time intelligence measures, you must import or create a date table. It is easy to create a date table in Power BI.
- Go to the Table view >> select New table
- Insert the following DAX formula
Calendar =
ADDCOLUMNS (
    CALENDAR ( DATE(2024,1,1), DATE(2025,12,31) ),
    "Year", YEAR ( [Date] ),
    "MonthNo", MONTH ( [Date] ),
    "Month", FORMAT ( [Date], "MMM" ),
    "YearMonth", FORMAT ( [Date], "YYYY-MM" ),
    "Quarter", "Q" & ROUNDUP ( MONTH ( [Date] ) / 3, 0 ),
    "Week", WEEKNUM([Date], 2)
)

- Mark Calendar as a date table using Calendar[Date]

- Create a relationship between Calendar[Date] ➜ Sales[OrderDate]

Create DAX Measures:
Let’s create measures using DAX for key metrics like:
- Total Sales
Total Sales = SUM(Sales[SalesAmount])
- Total Cost
Total Cost = SUM(Sales[Cost])
- Total Orders
Total Orders = DISTINCTCOUNT ( Sales[OrderID] )
- Average Order Value
AOV = DIVIDE ( [Total Sales], [Total Orders] )
- Profit Margin %
Profit Margin % = DIVIDE([Total Sales] - [Total Cost], [Total Sales], 0)
- Sales YTD
Sales YTD = TOTALYTD ( [Total Sales], 'Calendar'[Date] )
- Sales Previous Year
Sales Prev Year =
CALCULATE ( [Total Sales], SAMEPERIODLASTYEAR ( 'Calendar'[Date] ) )
- YOY Growth %
YOY Growth % = DIVIDE ( [Sales YTD] - [Sales Prev Year], [Sales Prev Year] )
- Or use the following DAX measure to avoid #NUM! errors at the start of the year
YOY Growth % =
VAR PY = [Sales Prev Year]
RETURN
IF ( ISBLANK(PY) || PY = 0, BLANK(), DIVIDE([Sales YTD] - PY, PY) )

- Give measures clear names, descriptions, and formats (currency, % with 1–2 decimals). These names and formats are exactly what Excel will show
- Tidy the field list:
- Hide raw columns users don’t need (e.g., UnitPrice, Discount) if a measure supersedes them
- Use Display Folders (e.g., “Sales KPIs”, “Time Intelligence”) so Excel’s field list is friendly
- Hide unnecessary columns that shouldn’t clutter Excel users’ PivotTables
1.5. Build Visuals in Power BI
Once data is imported, a data model is created, and DAX measures are defined, you can create visuals in the Report view.
- Add visuals (charts, tables, KPIs, cards) to present insights
- Insert slicers and filters for interactivity
- Keep the layout clean and well-labeled so Excel users can understand what they’re connecting to later

Tip: Use a shared workspace where your Excel users have Viewer or higher permissions.
1.6. Publish to Power BI Service
When your dataset and visuals are ready:
- Go to the Home tab >> select Publish
- Select the appropriate workspace in Power BI service
- Choose Select

Step 2: Connect Excel to Power BI
From Power BI Service:
Once your report is published:
- Open your report in the Power BI service
- Go to My workspace >> select your report
- Hover over your dataset and click the More options (⋯) menu
- Select Analyze in Excel

- If prompted, download the Analyze in Excel update
- This installs the necessary OLE DB driver to connect Excel to Power BI datasets

- Open the Power BI dataset connection in Excel

From Excel Directly:
In Excel,
- Go to the Data tab >> select Get Data >> select From Power Platform >> select From Power BI
- Sign in with your organizational account. Your Excel and Power BI accounts must be signed in with the same account

- Navigate to the Power BI dataset you published
- Search for your dataset or report
- Select Insert PivotTable or Table

Step 3: Build Your Excel Exploration
Once connected, you can:
- Insert PivotTables using your Power BI fields and measures
- Drag and drop measures into rows, columns, and values
- Rows: Category, Year
- Values: Total Sales, Total Cost, AOV, Total Orders, YOY Growth % (Power BI measure)
- Apply Excel formatting, conditional formatting, and slicers

Because the measures are defined in Power BI, calculations are consistent across all reports and users.
Keep Data Secure: Even though users are exploring in Excel, they only have access to the data they are permitted to see in Power BI. If you have Row-Level Security (RLS) set up, it will still apply in Excel.
Maintain a Single Source of Dataset
By using Power BI as the central data model and Excel as the exploration tool:
- Any updates to your Power BI dataset automatically reflect in Excel
- No more emailing static Excel files
- Everyone analyzes the same dataset version
Conclusion
By following these steps, you can build reports in Power BI and let users explore in Excel. Our tutorial covered the use of both platforms. By combining Power BI’s centralized, secure data models with Excel’s familiar flexibility, you can give your organization the best of both worlds. This approach keeps Power BI as the trusted engine and Excel as the comfortable steering wheel. Though calculations (DAX) are done in Power BI, it still gives people the freedom to pivot, chart, and build their views in Excel without spawning conflicting extracts.
Get FREE Advanced Excel Exercises with Solutions!
