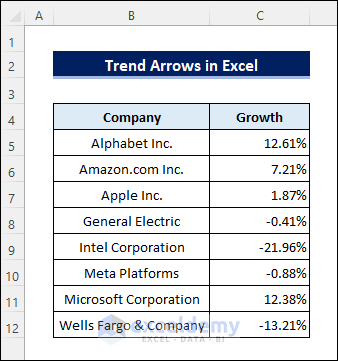
The following dataset contains year-to-year growth rates of some companies.
Method 1 – Add Trend Arrows with the Conditional Formatting
Steps:
- Select C5:C12.
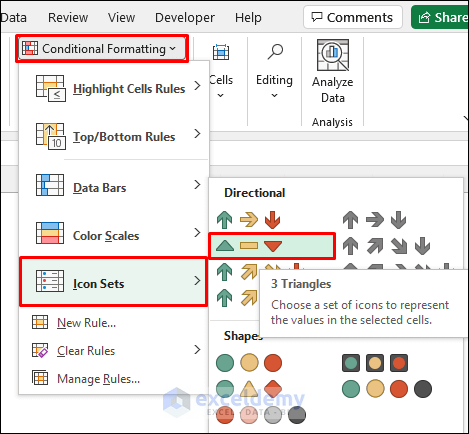
- Select Home >> Conditional Formatting >> Icon Sets >> 3 Triangles, as shown below.
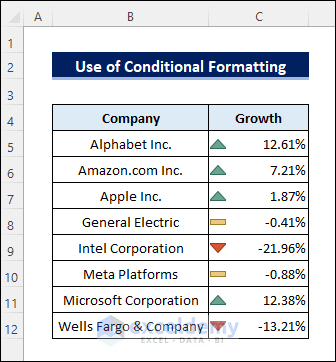
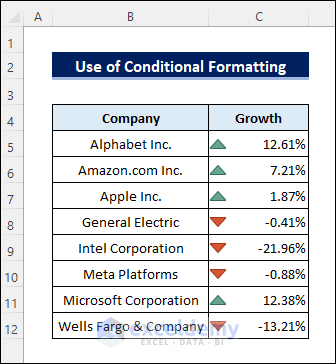
This is the output.
- Select the range again.
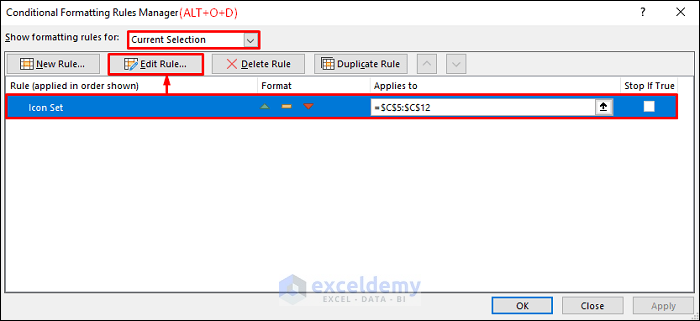
- Select Home >> Conditional Formatting >> Manage Rules.
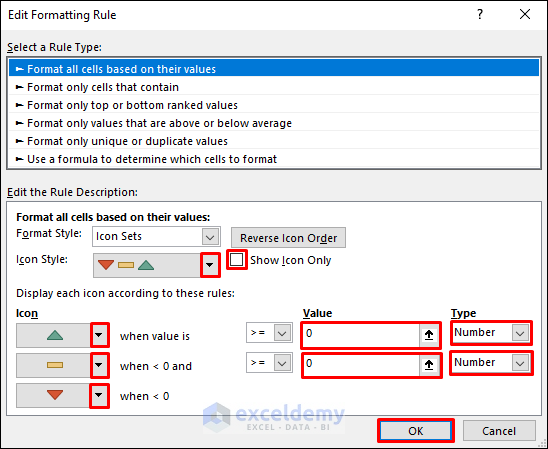
- Choose a rule.
- Click Edit Rule.
- Change the Type to Number.
- Enter zeros in Value.
- Click OK.
- You can change a particular icon or the icon style using the dropdowns. You can also show the icons by checking Show Icon Only.
- Click Apply.
- Click OK to see the result.
Read More: How to Add Up and Down Arrows in Excel
Method 2 – Applying the Custom Number Format to Add Trend Arrows
Steps:
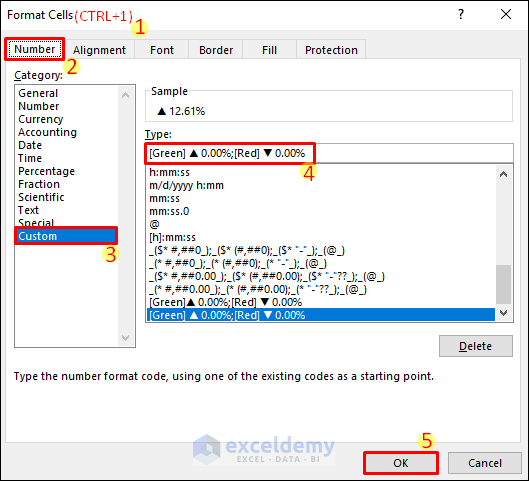
- Select the range and press CTRL+1 to open the Format Cells dialog box.
- Go to Custom number format.
- Enter [Green] ▲ 0.00%;[Red] ▼ 0.00% in Type and click OK.
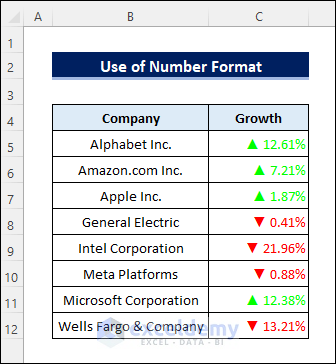
You will see the following result.
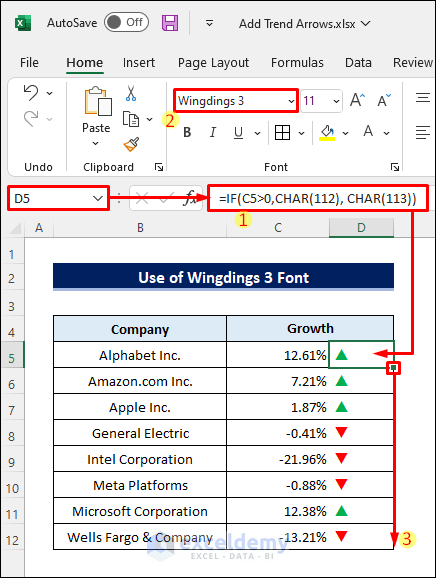
Method 3 – Insert Trend Arrows Using the Wingdings Font with the CHAR and IF Functions
- Enter the following formula in D5.
=IF(C5>0,CHAR(233), CHAR(234))- Change the font to Wingdings 3. You can apply conditional formatting to show green and red arrows for positive and negative values.
- Drag down the Fill Handle to copy the formula.
This is the output.
Read More: How to Insert Trend Arrows Based on Another Cell in Excel
Things to Remember
- Modify the rule for conditional formatting while using icon sets with more than three icons.
- Remove the color names in the custom number format to keep the font colors unchanged.
- Modify the formula to add arrows other than the up and down arrows.
Download Practice Workbook
Download the practice workbook.
Related Articles
- Double Headed Arrow in Excel
- How to Insert Curved Arrow in Excel
- How to Use Blue Line with Arrows in Excel
- How to Show Tracer Arrows in Excel
- Up and Down Arrows in Excel Using Conditional Formatting
- How to Remove Tracer Arrows in Excel
<< Go Back to Arrows in Excel | Excel Symbols | Learn Excel
Get FREE Advanced Excel Exercises with Solutions!
