Sometimes, we need to determine the value of the Z score at different levels of confidence, according to our desire. In this article, we will demonstrate to you the step-by-step procedure to calculate the Z score with a 95 confidence interval in Excel. If you are also curious about it, download our practice workbook and follow us.
What Is Z Score?
Z Score is a special type of value that indicates how far the value is from the mean. The general formula for the Z score is:

Here,
- Z represents the value of the Z score
- X is the value of any case
- μ stands for the Mean value
- σ represents the value of the Standard Deviation
Read More: How to Calculate Z Score in Excel
What Is Confidence Interval?
In statistics, a Confidence Interval describes the likelihood that a dataset parameter will fall between a set of values for a predetermined percentage of the time. Analysts frequently employ Confidence Intervals that include 95% or 99% of anticipated observations.
How to Calculate Z-Score with 95 Confidence Interval in Excel
Here, we will show the manual calculation process of the Z score. The steps of this manual process are given below:
📌 Steps:
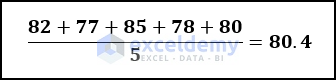
- First, choose a dataset. Here, we use a simple dataset with 5 data. Those 5 values are 82, 77, 85, 78, and 80.
- Second, we will estimate the simple Mean of this dataset.
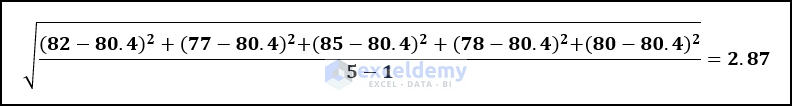
- Third, we have to evaluate the Standard Deviation of our data.
- You can see that the value of the Standard Deviation is 2.87. So, the dataset is normally distributed.
- Choose your desired confidence level interval. For our data, we set it at 95%.
- After that, in the Z-Score chart, we have to find out the value of 0.975 (e.g. 0.95+(0.05/2)=0.975).
- Now, you may notice that the Vertical Axis value for 0.975 is 1.9 and the Horizontal Axis value is 0.06.
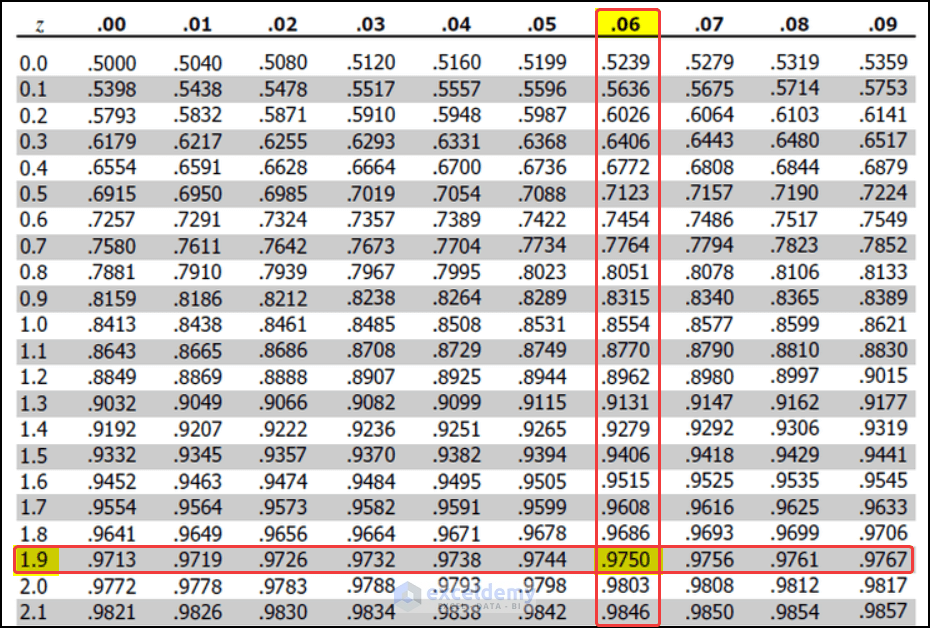
- Thus, our Z-score value for a 95% confidence interval will be 1.9+0.06 = 1.96.
So, we can say that we are able to estimate the Z score with a 95 confidence interval manually.
How to Calculate Z-Score with 95 Confidence Interval in Excel: Step-by-Step Procedure
In this section, we are going to show you the step-by-step procedure to evaluate the Z-score value with a 95 confidence interval in Excel.
Step 1: Calculate Mean of Dataset
In this first step, we will calculate the Mean value of our total marks number. For that, we are going to use the AVERAGE function.
- At first, select cell F5.
- Now, write down the following formula in the cell.
=AVERAGE(C5:C14)
- Press Enter.
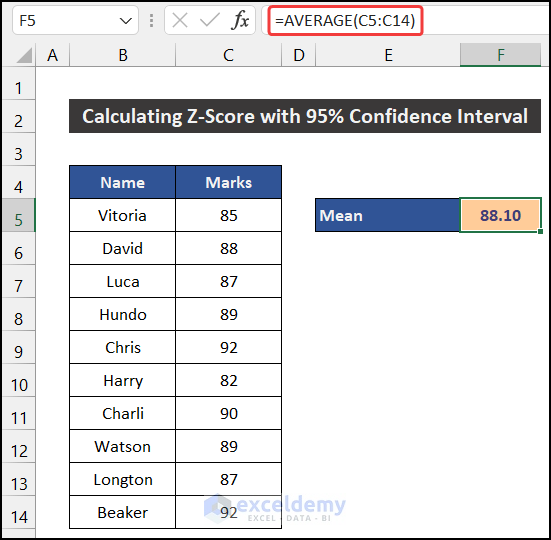
- You will get the value of the mean of our dataset.
Thus, we can say that we have completed the first step, to calculate the Z score with a 95 confidence interval in Excel.
Step 2: Estimate Standard Deviation
Now, we are going to estimate the Standard Deviation of our dataset. To determine the value, we will use the STDEV.P function.
- First, select cell F6.
- After that, write down the following formula in the cell.
=STDEV.P(C5:C14)
- Press the Enter key.
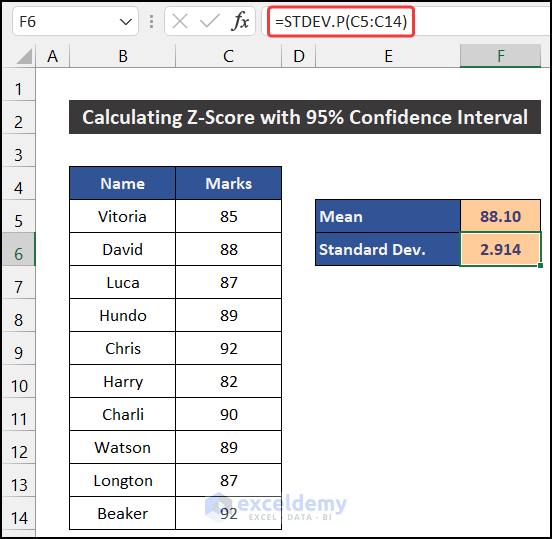
- You will get the value of the Standard Deviation.
- Now, you may notice that the value of the Standard Deviation is 2.914. So, we can make the decision that our dataset is normally distributed.
So, we can say that we have finished the second step, calculating the Z score with a 95 confidence interval in Excel.
Step 3: Define Confidence Interval Level
In this step, we have to define our confidence level interval.
- At first, title cells E7 and E8 as Confidence level and Alpha, respectively.
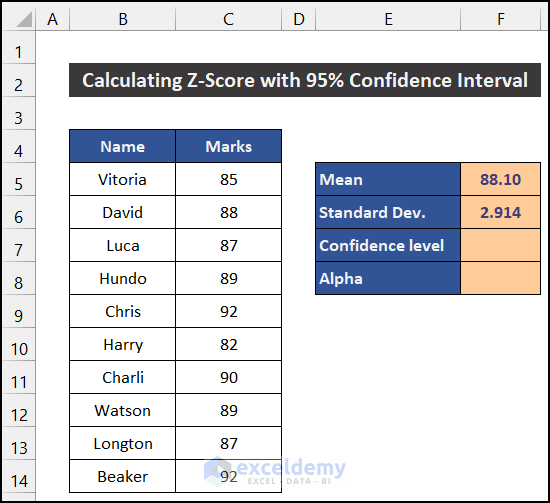
- Now, in cell F7, define the Confidence level. Here, we define our confidence interval which is 95%.

- After that, in cell F8, write down the following formula to get the Alpha value.
=1-F7
- Then, press Enter.
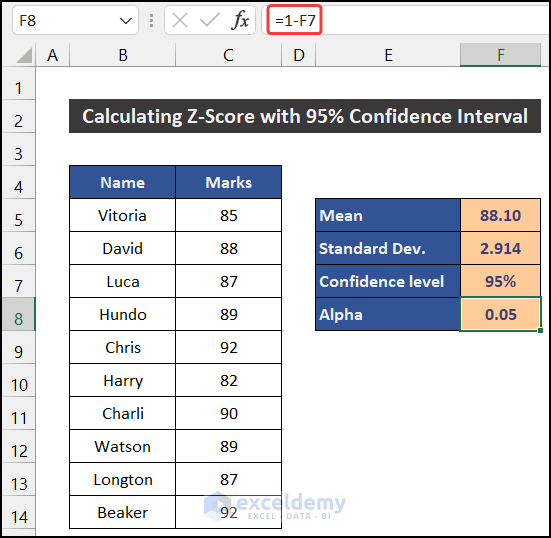
- Our task is completed.
Therefore, we can say that we have accomplished the third step, calculating the Z score with a 95 confidence interval in Excel.
Step 4: Estimate Z Score for Desired Confidence Interval
In this final step, we will estimate the Z score value for our desired confidence interval level. To determine the value of the Z score, we will use the NORM.S.INV and ABS functions.
- Firstly, select cell F10.
- Now, write down the following formula in the cell.
=ABS(NORM.S.INV((F8)/2))
- Press Enter.
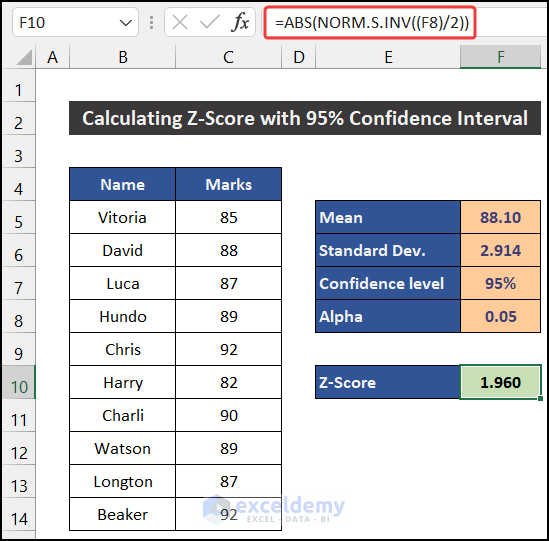
- You will get the Z score value with a 95 confidence interval level which is equal to the manual procedure.
Finally, we can say that we have finished the final step, calculating the Z score with a 95 confidence interval in Excel.
🔎 Breakdown of the Formula
We are breaking down the formula for cell F10.
👉 NORM.S.INV((F8)/2): The NORM.S.INV function provides us with the Z-score value of 0.025. As this interval level is at the right side of the mean position, the value will show a negative sign. Here, the function returns -1.960.
👉 ABS(NORM.S.INV((F8)/2)): The ABS function will show the absolute value of the result of the NORM.S.INV function. For this cell, the function returns 1.960.
Read More: How to Calculate Critical Z Score in Excel
Download Practice Workbook
Download this practice workbook for practice while you are reading this article.
Conclusion
That’s the end of this article. I hope that this article will be helpful for you and you will be able to calculate the z-score 95 confidence interval in Excel. Please share any further queries or recommendations with us in the comments section below if you have any further questions or recommendations. Keep learning new methods and keep growing!
Related Articles
- How to Calculate Altman Z Score in Excel
- How to Calculate P Value from Z Score in Excel
- How to Calculate Probability from Z-Score in Excel
<< Go Back to Z Score in Excel | Statistical Significance in Excel | Excel for Statistics | Learn Excel
Get FREE Advanced Excel Exercises with Solutions!
