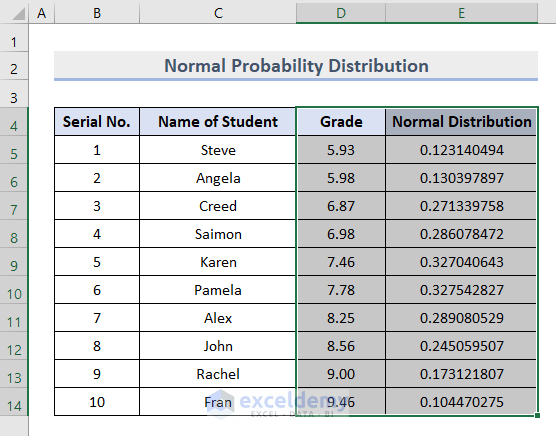
While working in Microsoft Excel with the sales-related worksheets, sometimes we need to give formatting data series. The chart shows you a trend in ...
To combine bar and line graphs, we are going to use the following dataset. It contains some months, as well as total unit sales and the total amount ...
Method 1 - Add Data to an Existing Chart on the Same Worksheet by Dragging
We have a dataset of sales for sales assistants who work at a shop over a ...
If you are searching for the solution or some special tricks to create color rings on a Radar chart in Excel then you have landed in the right place. ...