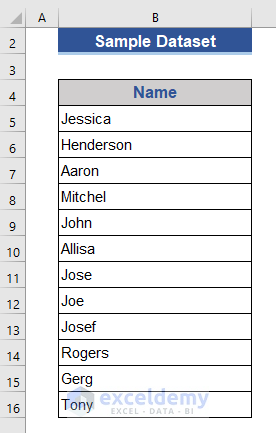
We can split data in different ways, i.e., how many groups you want or how many cells each group needs to contain. To show all the methods, we will use the following dataset.
Method 1 – Combine INDEX, COLUMNS, ROWS, and IF Functions to Split Data into Equal Groups
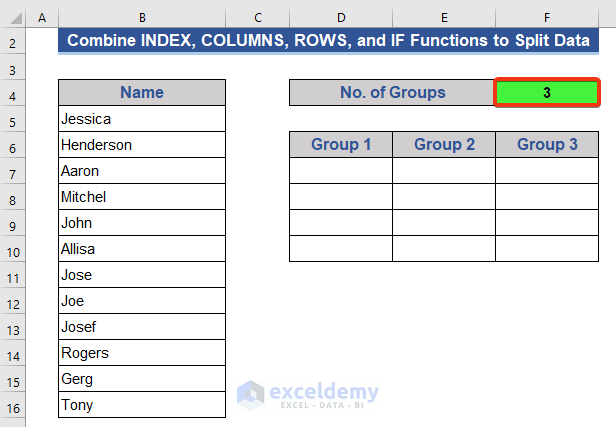
We will split the given data into 3 equal groups.
Steps:
- We have added the No. of Groups cell in the dataset and put 3 in the corresponding cell.
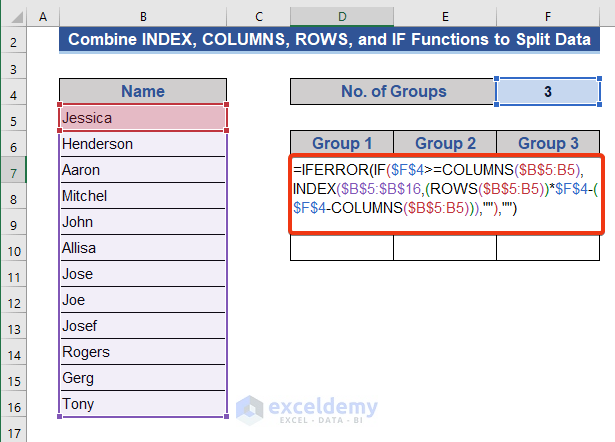
- Go to Cell D7.
- Put the following formula in that cell:
=IFERROR(IF($F$4>=COLUMNS($B$5:B5),INDEX($B$5:$B$16,(ROWS($B$5:B5))*$F$4-($F$4-COLUMNS($B$5:B5))),""),"")
- Press Enter and drag the Fill Handle icon to the right to AutoFill the other two cells.
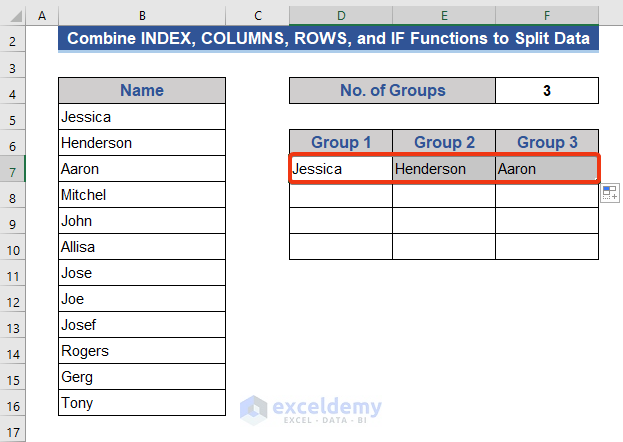
- Drag the Fill Handle icon downwards to complete the splitting.
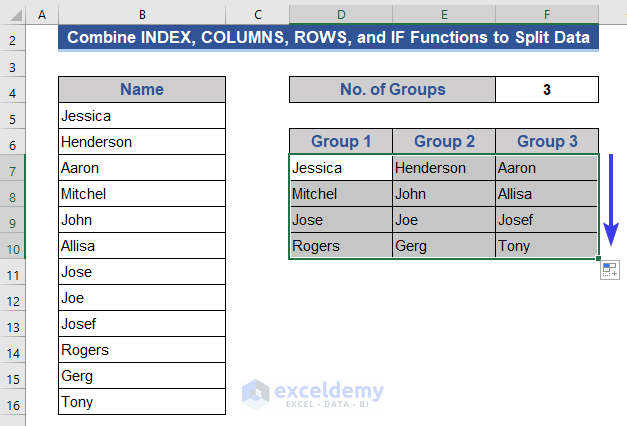
The data is split into multiple columns in different groups.
Formula Breakdown:
Here we are trying to get the 1st input in the 1st group (out of 3 groups). The groups are in a column-like arrangement.
- $F$4>=COLUMNS($B$5:B5)
The IF function first checks if the given condition is met. If the criteria are met, the later part of the formula will work, otherwise the IF function will return “”.
Result: TRUE
- $F$4-COLUMNS($B$5:B5)
This piece of formula subtracts the number of columns in the given range from the number of total groups.
Result: 2
- (ROWS($B$5:B5))*$F$4
Here, the number of rows in the given range is multiplied by the total number of groups.
Result: 3
- (ROWS($B$5:B5))*$F$4-($F$4-COLUMNS($B$5:B5))
This formula generates a row number which we will use as an argument for the INDEX function.
Result: 1
- INDEX($B$5:$B$16,1)
We get an output here from the given range as specified by the row number.
Result: “Jessica”
- IFERROR(IF($F$4>=COLUMNS($B$5:B5),INDEX($B$5:$B$16,(ROWS($B$5:B5))*$F$4-($F$4-COLUMNS($B$5:B5))),””),””)
The IFERROR function checks if there are any errors. If no error is found, then provide the output of the IF function.
Result: “Jessica”
Read More: How to Split Data from One Cell into Multiple Rows in Excel
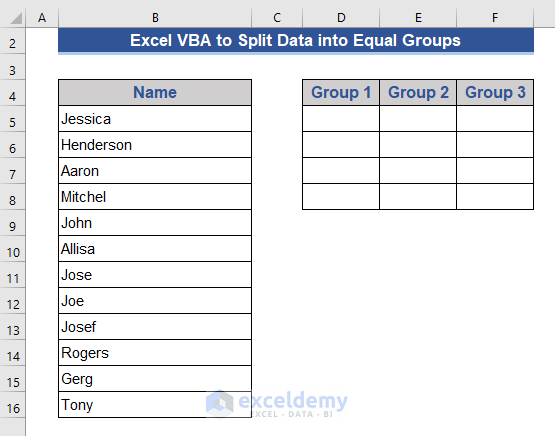
Method 2 – Split a Long List into Multiple Equal Groups with Excel VBA
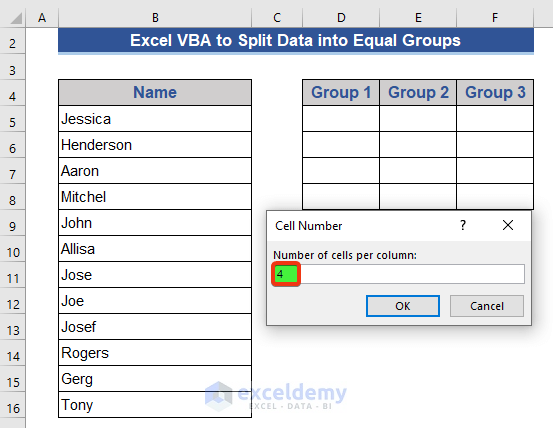
We have a long list containing 12 cells. We want to split them into 3 groups with 4 cells each.
Steps:
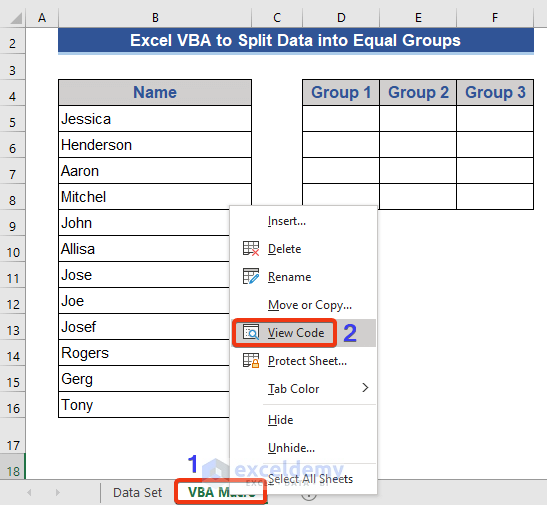
- Go to the Sheet Name section at the bottom border of each sheet and right-click on it.
- Choose the View Code option from the list.
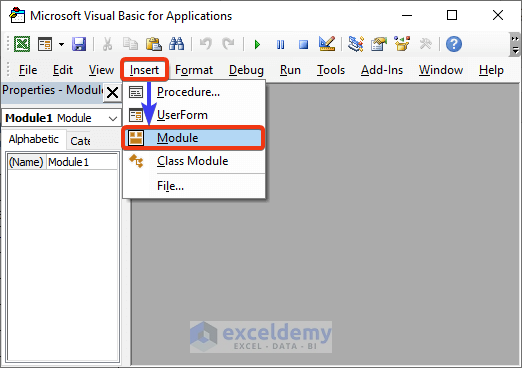
- The VBA application window will appear. Choose the Module option from the Insert tab.
- A VBA command module window appears.
- Copy and paste the following VBA code into the command module.
Sub split_data_into_equal_groups()
    Dim input_1 As Range
    Dim output_1 As Range
    Dim text_1 As String
    Dim out_array_1 As Variant
    Dim n, m As Long
    On Error Resume Next
    text_1 = ActiveWindow.RangeSelection.Address
Sel:
    Set input_1 = Nothing
    Set input_1 = Application.InputBox("Select input range:", "Range", text_1, , , , , 8)
    If input_1 Is Nothing Then Exit Sub
    If input_1.Areas.Count > 1 Then
        MsgBox "Multiple selections are not supported, select again", vbInformation, "Range"
        GoTo Sel
    End If
    If input_1.Columns.Count > 1 Then
        MsgBox "Multiple selections are not supported, select again", vbInformation, "Range"
        GoTo Sel
    End If
    Set output_1 = Application.InputBox("Select a cell to view the output:", "Start Range", , , , , , 8)
    If output_1 Is Nothing Then Exit Sub
    n = Application.InputBox("Number of cells per column:", "Cell Number", , , , , , 1)
    If n < 1 Then
        MsgBox "incorrect enter", vbInformation, "Cell Number"
        Exit Sub
    End If
    ReDim out_array_1(1 To n, 1 To Int(input_1.Rows.Count / n) + 1)
    For m = 0 To input_1.Rows.Count - 1
      out_array_1(1 + (m Mod n), 1 + Int(m / n)) = input_1.Cells(m + 1)
    Next
    output_1.Range("A1").Resize(n, UBound(out_array_1, 2)) = out_array_1
End Sub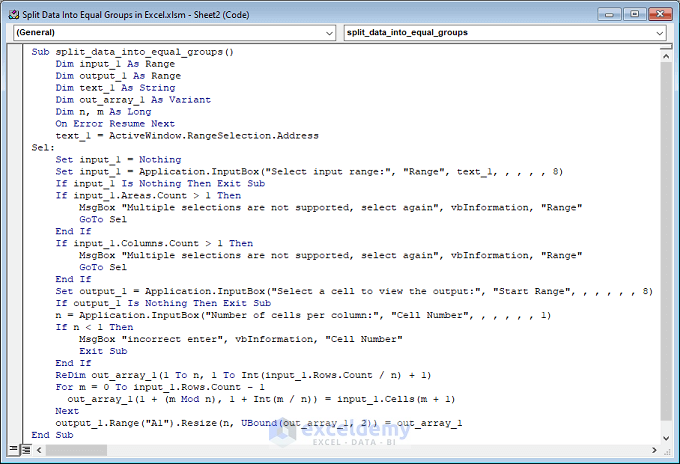
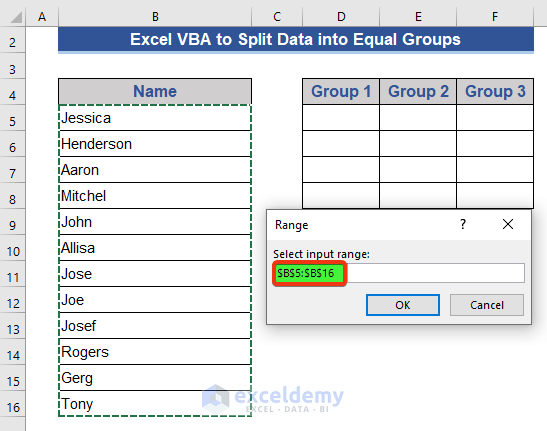
- Press F5 to run the code. A dialog box will appear to choose the range.
- We chose Range B5:B16 as the input.
- Press OK.
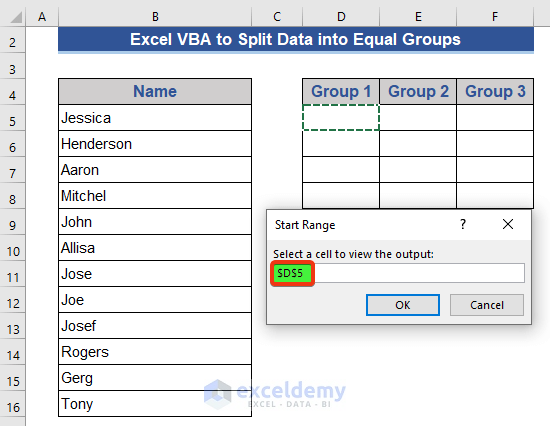
- The next dialog appears. This box requires a cell reference to start the output data. We selected Cell D5.
- Press OK.
- A third dialog box requests the number of items per group. Put 4 for the sample.
- Press OK.
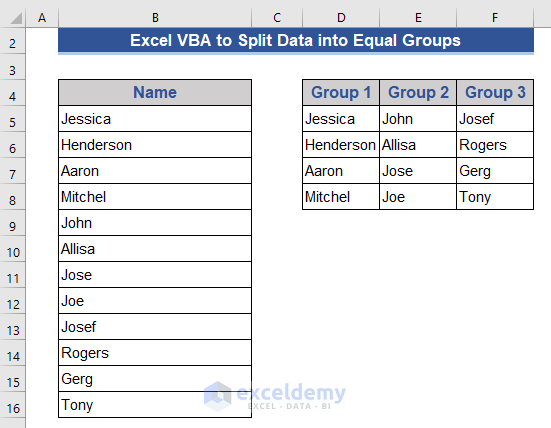
- Our data is split into 3 groups equally.
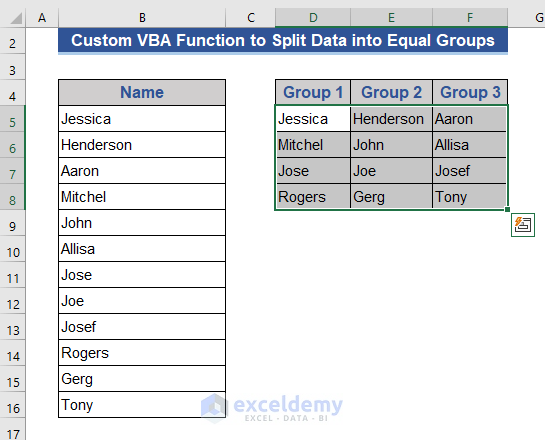
Method 3 – Use a Custom VBA Function to Split Data into Even Groups
Steps:
- Press Alt+F11 to enter the VBA command module.
- Put the following VBA code on the command module and save the code.
Function GroupValues(range_1 As Range)
Dim output As Variant
n = Application.Caller.Columns.Count
m = Application.Caller.Rows.Count
ReDim output(1 To m, 1 To n)
k = 1
For row_1 = 1 To m
    For column_1 = 1 To n
        If range_1.Cells(k) <> "" Then
            output(row_1, column_1) = range_1.Cells(k)
        Else
            output(row_1, column_1) = ""
        End If
        k = k + 1
    Next column_1
Next row_1
GroupValues = output
End Function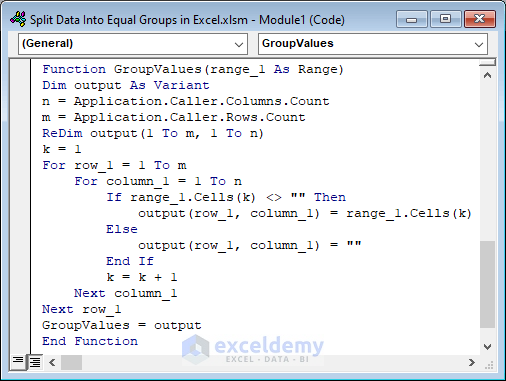
- Go to the dataset. Choose the range you want to turn into groups, such as the range D5:F8 from the example.
- Select the first cell of the grouping table (here that’s D5).
- Go to the formula bar and insert the following formula.
=GroupValues(B5:B16)
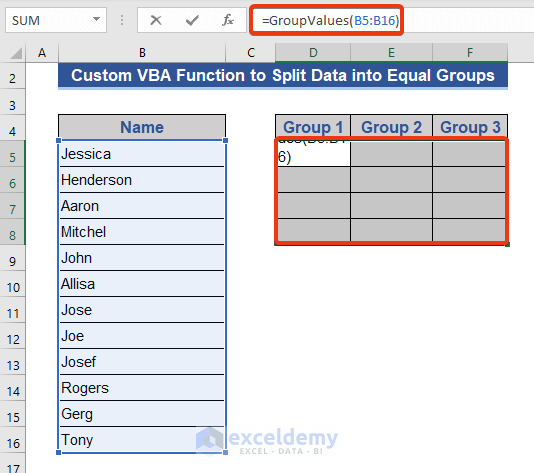
- This is an array formula, so press Ctrl + Shift + Enter to apply it.
Read More: Excel Macro to Split Data into Multiple Files
How to Split Data and Tag It with Group Numbers
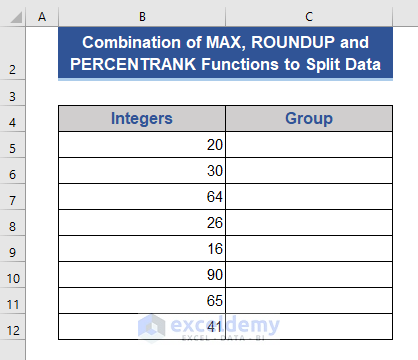
Method 1 – Split Data Using the Combination of MAX, ROUNDUP, and PERCENTRANK Functions
We will consider the dataset below, where we need to split the integers into buckets.
Steps:
- Go to Cell C5.
- Insert the following formula.
=MAX( ROUNDUP( PERCENTRANK($B$5:$B$12,B5) *4, 0),1)
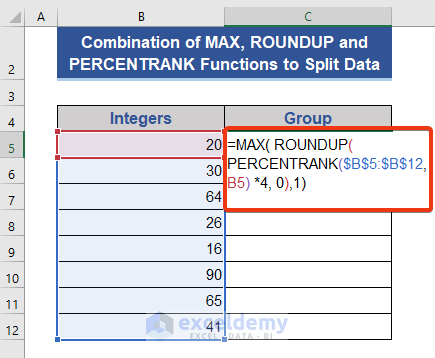
- Press the Enter key.
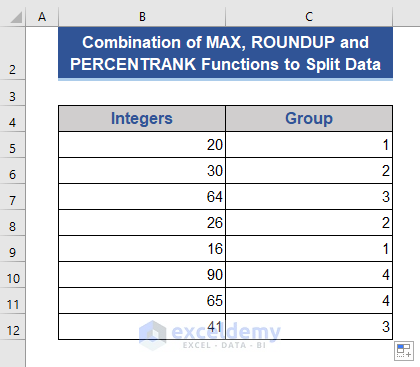
The cells are tagged with group numbers instead of splitting them.
Formula Breakdown:
- PERCENTRANK($B$5:$B$12,B5)
It calculates the percentage of Cell B5 comparing the Range B5:B12.
Result: 0.142
- PERCENTRANK($B$5:$B$12,B5) *4
Multiply the result by 4. This multiplication argument decides how many groups form.
Result: 0.568
- ROUNDUP( PERCENTRANK($B$5:$B$12,B5) *4, 0)
This rounds up the result up to 0 digits in the decimal section.
Result: 1
- MAX( ROUNDUP( PERCENTRANK($B$5:$B$12,B5) *4, 0),1)
This provides the biggest number based on the roundup result.
Result: 1
Method 2 – Combining ROUNDUP, ROW, and COUNT Functions to Split Data
Steps:
- Go to Cell C5 and put the following formula.
=ROUNDUP(ROW()/(COUNT(B:B)/1),0)
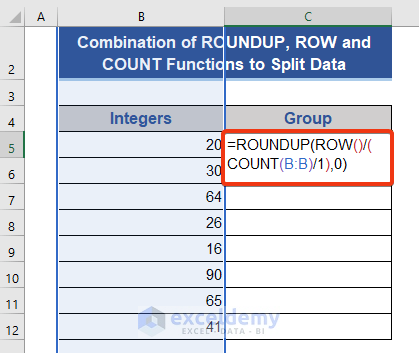
- Press the Enter key to execute the formula.
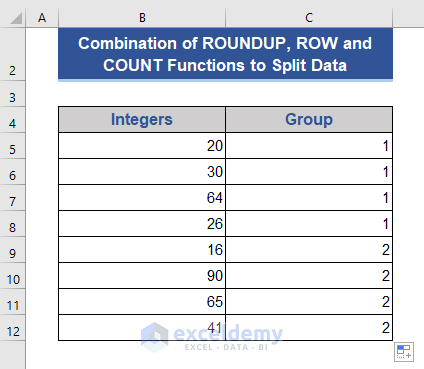
- The function split the numbers into two groups based on order of appearance in row rather than value.
Formula Breakdown:
- COUNT(B:B)
This counts the number of cells containing numeric data of Column B.
Result: 8
- COUNT(B:B)/1
Divide the previous result by 1.
Result: 8
- ROW()
Count the number of rows containing data.
Result: 8
- ROW()/(COUNT(B:B)/1)
Divide the result of the ROW function by the result of the COUNT function.
Result: 1
- ROUNDUP(ROW()/(COUNT(B:B)/1),0)
Rounds up the previous result.
Result: 1
Download the Practice Workbook
Related Articles
- Excel Split Data into Columns by Comma
- How to Split Comma Separated Values into Rows or Columns in Excel
- Split Data into Multiple Worksheets in Excel


Good afternoon,
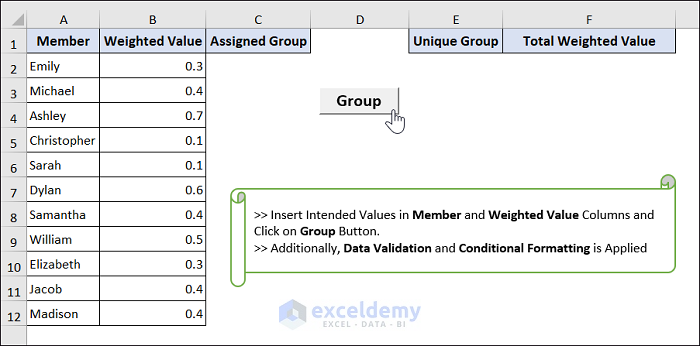
I am looking for help to take this equation one step further. I have a value assigned to each member. I am trying to figure out how to create a formula that will split them into equal groups while making sure the total value of each group is within 1. Any help would be greatly appreciated.
Thank you
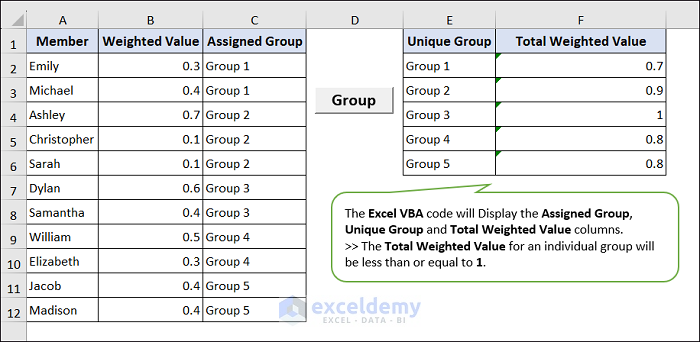
Hello DYLAN,
Thank you for reaching out to us on our website. I understand that you have a value assigned to each member and are trying to split them into equal groups while ensuring each group’s total weight is within 1. Based on your requirements, I can assist you with this by applying an Excel VBA code.
The above VBA code splits a list of items into groups based on their assigned value and calculates the total weighted value for each unique group. It loops through each row of the worksheet, sets each item to a group based on the total weighted value of the group, and creates a new group if the current group's total weighted value plus the contemporary item's assigned value is greater than 1. The GetUniqueValues function calculates the unique groups and their total weighted values by using the Unique and SUMIFS functions to generate an array of unique values in column C and calculate the total weighted value for each group.
1) Inserting Required Values:
2) Displaying Final Output:
3) Download Practice Workbook
https://www.exceldemy.com/wp-content/uploads/2023/03/Dylans-Request.xlsm
Thank you again for reaching out to us, and I look forward to hearing from you soon.
Best regards,
Lutfor Rahman Shimanto
Hello,
I am trying to create a custom VBA function which will be able to group the dynamic set of rows into equal (roundoff) parts. For example, I get the data in 99 rows and now I want to distribute it with 5 people. So I need a function in which I will define the range i.e. A$1:A$99 and then when I put in the “5” it should give me the value in the adjacent cell range B1:B99 wherein it has been divided the 99 rows by 5 and I have the data like
1 20 times
2 20 times
3 20 times
4 20 times
5 19 times
Can this be done? It’d be really helpful if you could show me the way.
Thanks
Hello Aadi
Thanks for visiting our blog and sharing such an interesting problem. I am delighted to inform you that I have developed an Excel VBA User-Defined function to fulfil your goal.
Follow these steps:
As a result, you will see an output like the following GIF.
Hopefully, the User-defined function has fulfilled your goal. I am also attaching the solution workbook for better understanding; good luck.
Download Solution Workbook
Regards
Lutfor Rahman Shimanto
Excel & VBA Developer
ExcelDemy