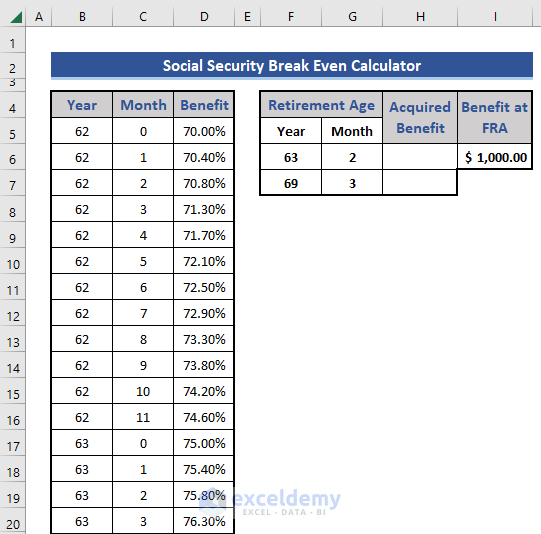
Method 1 – Insert Primary Information
- Insert basic information to compare two ages and 100% benefits in the dataset.
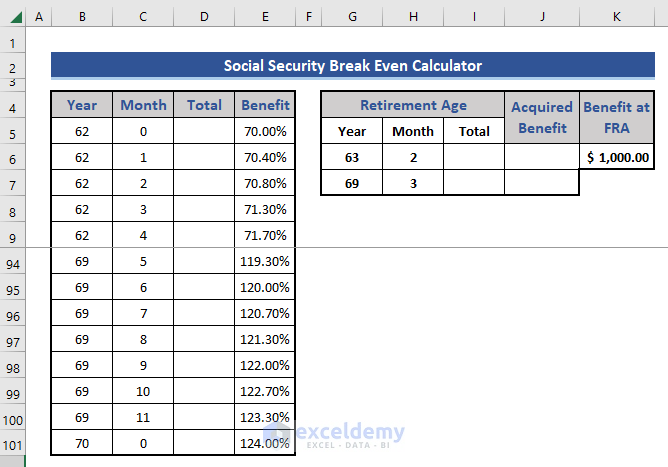
Method 2 – Calculate the Total Months
- Insert two new rows to calculate the total months in the dataset.
- Go to cell D5 and put in the following formula.
=$B5*12+$C5
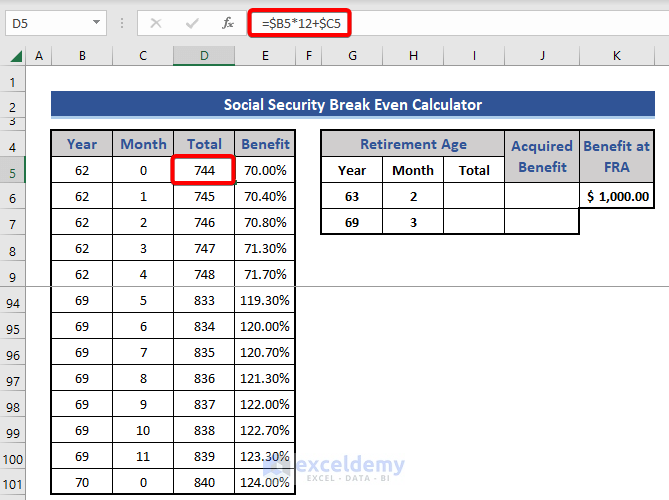
This will help you find the benefit percentage based on the age at which you took retirement. Expand this formula to the end.
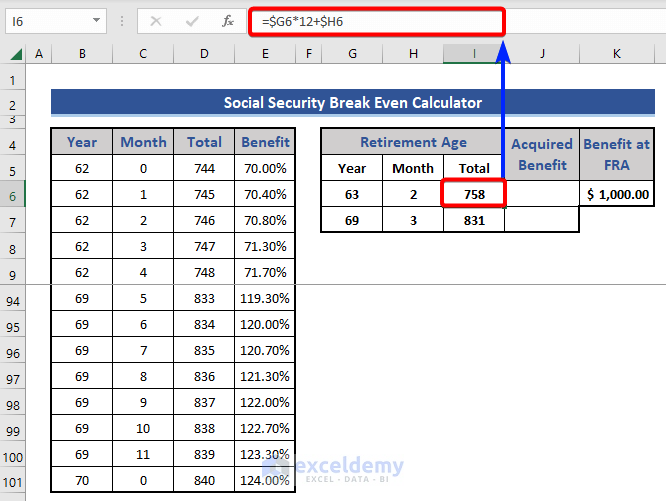
- Put another formula for cell I6 and I7.
=$G6*12+$H6
Method 3 – Find out Benefit Percentage
Use the VLOOKUP function to calculate the benefit percentage at different retirement ages.
- Put the following formula on cells J6 and J7.
For cell J6:
=VLOOKUP($I6,$D$5:$E$101,2,FALSE)
For cell J7:
=VLOOKUP($I7,$D$5:$E$101,2,FALSE)
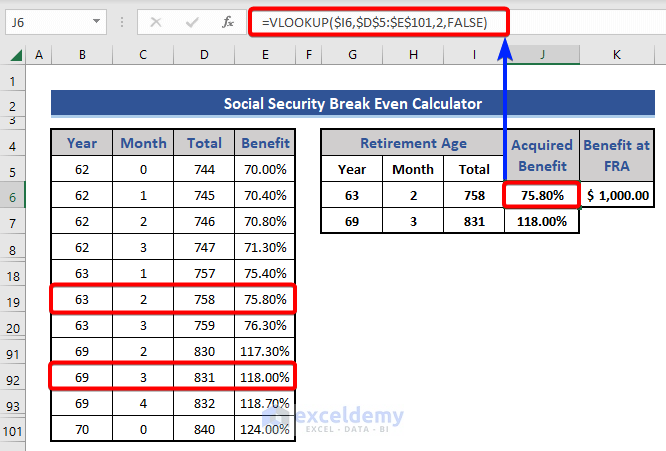
We successfully find out the percentage from the list at different retirement ages.
Method 4 – Calculate Cumulative Social Security Benefit
Here, the 1st retirement age is 63 years and 2 months. The person will benefit in the next month, which is 63 years and 3 months. After that, this will continue for a lifetime.
- Apply a formula on cell O6 to get the cumulative benefit for the 1st retirement age.
=IF($I$6<=($M5*12+$N5),$K$6*$J$6+$O5,0)
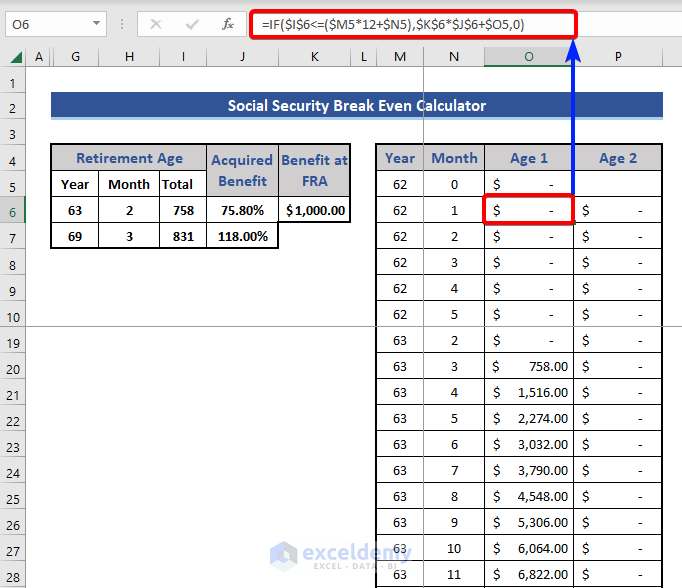
Expand this formula to the last. We used the IF function in this formula.
- Use another similar formula on cell P6 for the cumulative benefit at 2nd retirement age.
=IF($I$7<=($M5*12+$N5),$K$6*$J$7+$P5,0)
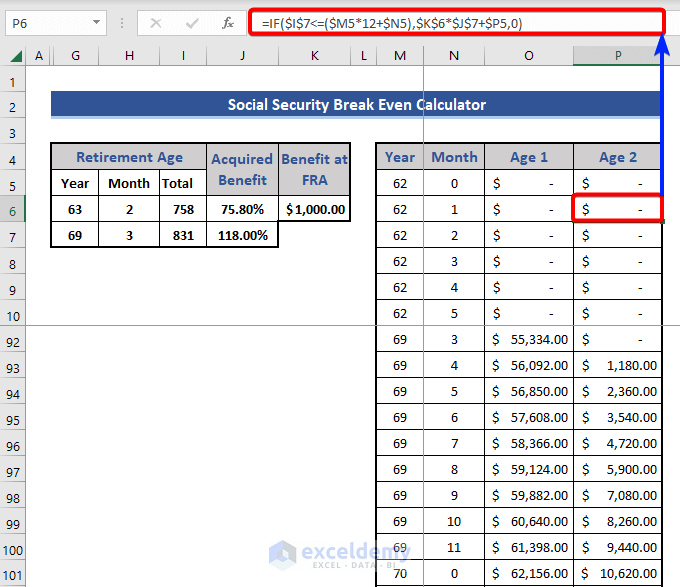
Expand this to the last cell.
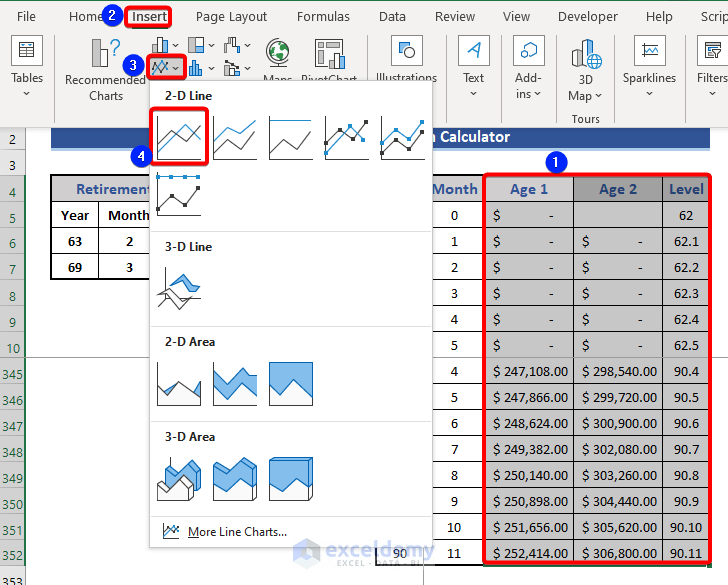
Method 5 – Insert Data in a Chart to Find the Break-Even Point
- Add a new column named Level for year-defining value.
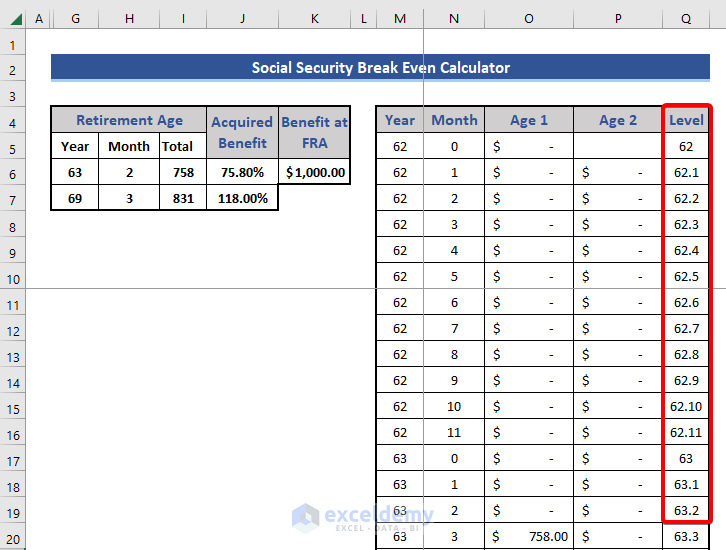
- Select the whole data from the three columns Age 1, Age 2, and Level.
- Go to the Insert tab.
- Choose the Line option from the Charts group.
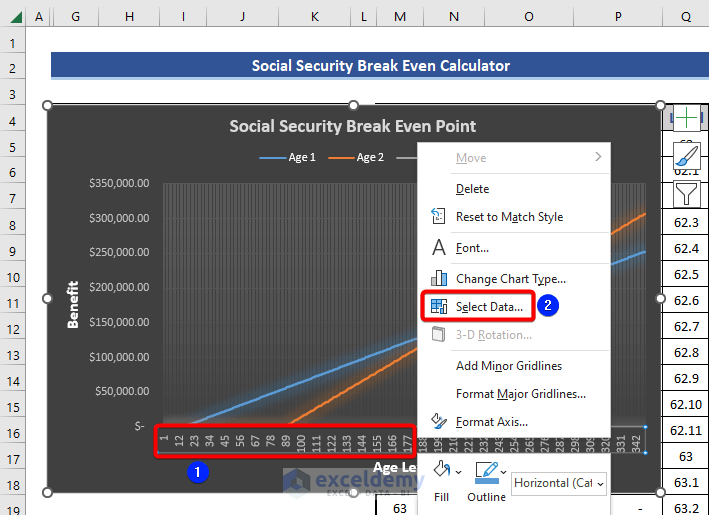
- Look at the following chart. Here, we will change the data of the horizontal axis.
- Choose the horizontal axis and press the right button of the mouse.
- Click the Select Data option from the menu.
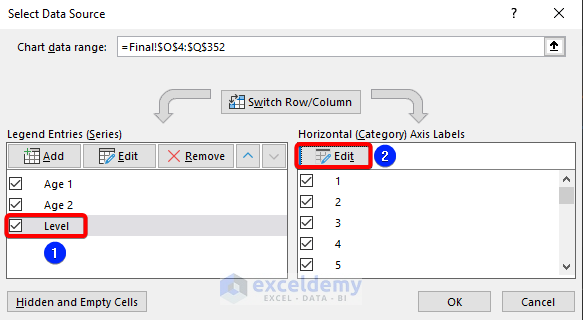
- Select Data Source window appears.
- Choose the Level option from the Legend Entries section.
- Choose the Edit option from the Horizontal Axis Labels section.
- Choose the Level column as the Axis label range.
- Press the OK button.
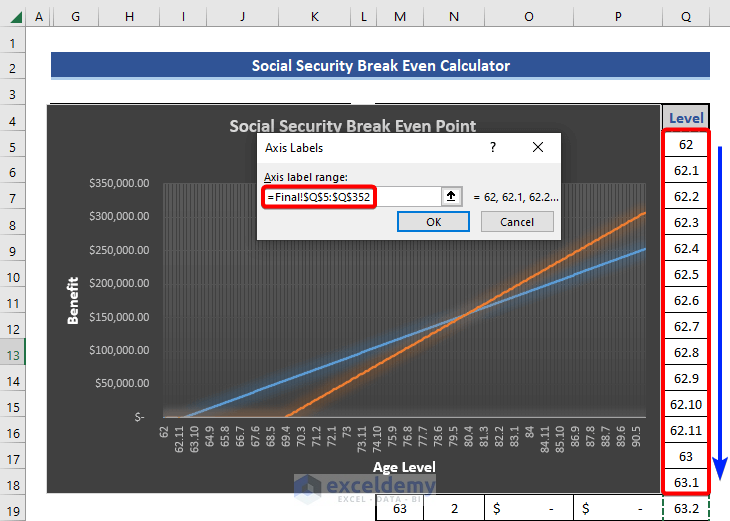
- Look at the chart now.
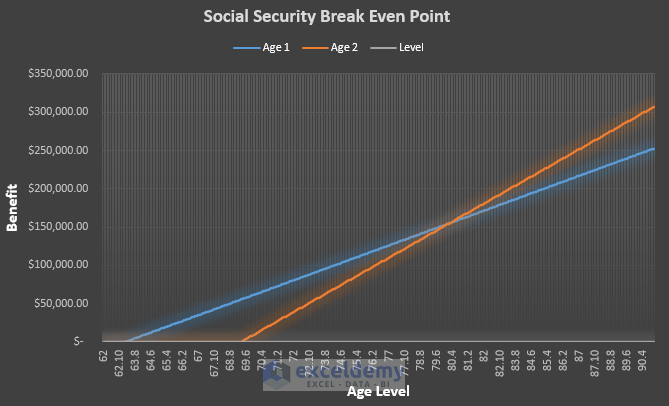
The chart will give us an idea of the break-even point, but we have to find it manually from the chart or the dataset.
Method 6 – Find Out the Break-Even Point
- Add a new column in the dataset. Put a formula on cell R5.
=IF(IF(AND(O5<>0,P5<>0),O5-P5,"N/A")<>"N/A",ABS(O5-P5),"N/A")
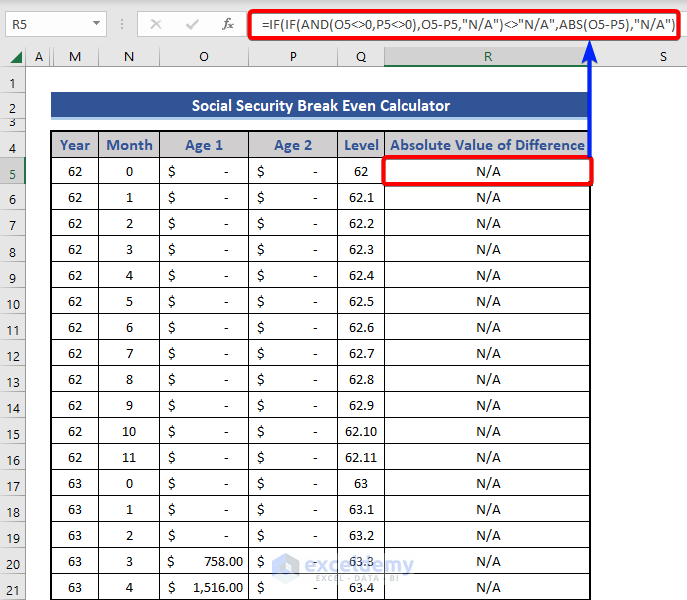
This formula uses the nested IF function to find the absolute values of the difference between the benefits of age 1 and age 2. We added a condition that when Age 1 and Age 2 are both 0, the subtraction formula will not be applied.
Formula Breakdown:
- AND(O5<>0,P5<>0)
It follows two conditions. Check if O5 and P5 are not equal to 0.
Result: False.
- IF(AND(O5<>0,P5<>0),O5-P5,”N/A”)
IF function returns the difference between O5 and P5 when fulfilling the condition. Otherwise returns “N/A”
Result: N/A.
- IF(IF(AND(O5<>0,P5<>0),O5-P5,”N/A”)<>”N/A”,ABS(O5-P5),”N/A”)
IF function works based on the value of the previous section. If the value of the previous section is not equal to N/A, give the absolute value of the difference between cell O5 and P5, Otherwise, return N/A.
Result: N/A.
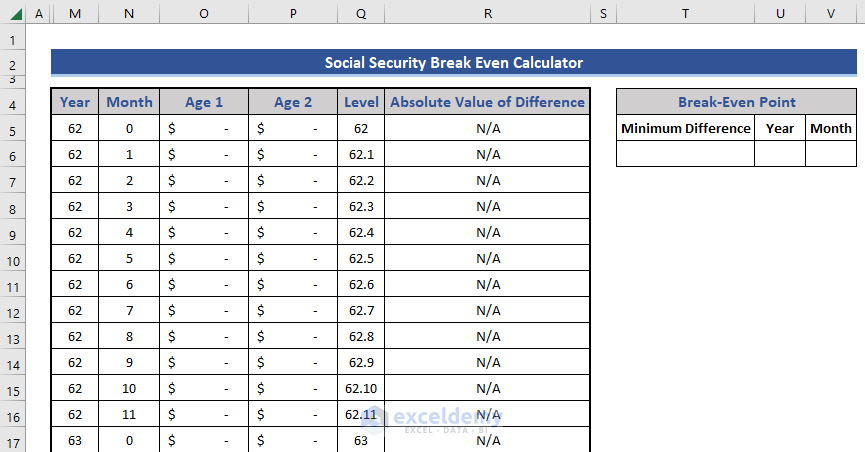
- Add a section in the dataset to find out the break-even point.
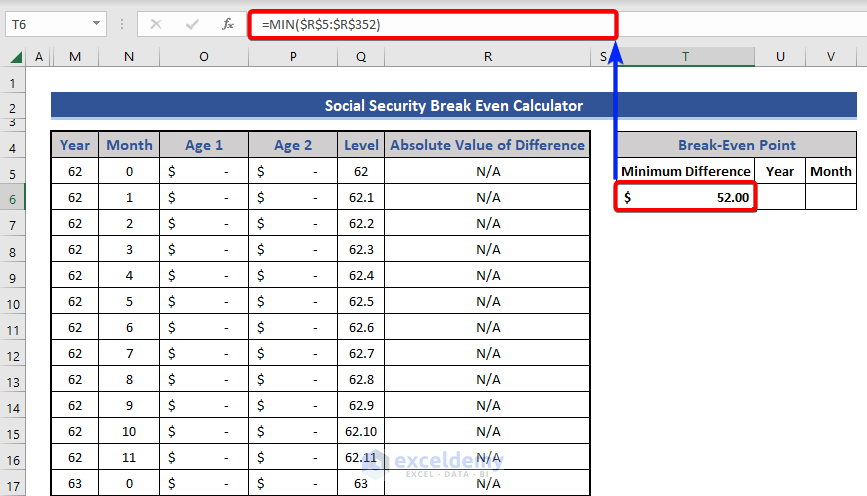
- Use the following formula based on the MIN function to get the minimum difference at cell T6.
=MIN($R$5:$R$352)
=INDEX($M$5:$M$352,MATCH($T$6,$R$5:$R$352,0))
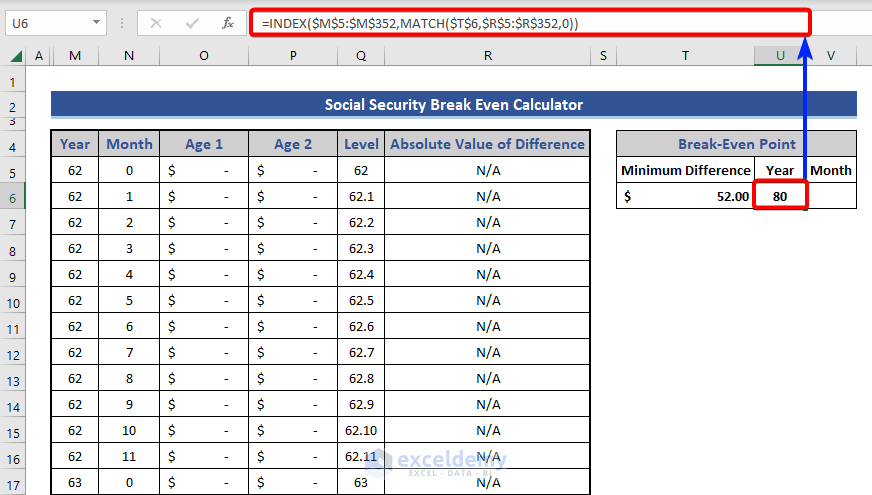
This returns the Year value. The INDEX-MATCH formula works based on the minimum difference between two ages.
- Find out the Month value.
=INDEX($N$5:$N$352,MATCH($T$6,$R$5:$R$352,0))
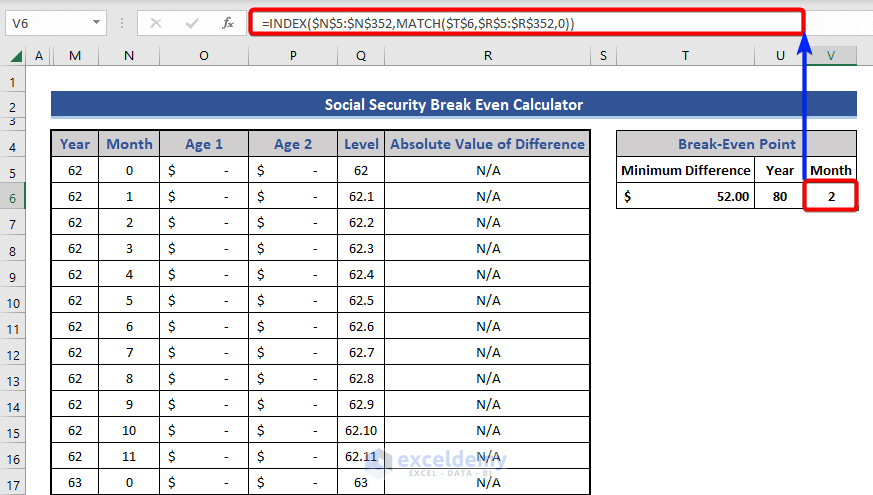
Get the break-even point at age 80 years and 2 months.
Download Practice Workbook
Download this practice workbook to exercise while you are reading this article.
<< Go Back to Break-Even Analysis | Finance Template | Excel Templates
Get FREE Advanced Excel Exercises with Solutions!

All of these formulas and spreadsheets are fine if your FRA is age 67. My FRA is 66 years and 8 months. How would or could I calculate that?
I’m not an excel expert at all.
Hello Stephen Dolson,
Thanks for your comment! You’re right! the calculator uses 67 as the default Full Retirement Age (FRA), but you can easily change it to 66 years and 8 months.
Here’s how to do it, even if you’re not an Excel expert:
Convert your FRA to months:
66 years × 12 = 792 months
792 + 8 months = 800 months
In the spreadsheet, look for any formulas or cells that use 804 (which is 67 years × 12 months) and replace it with 800.
This small change will adjust the break-even calculation to match your correct FRA. If you’d like, I can walk you through exactly where to update it!
Regards
ExcelDemy
Hi!
I would also like to know exactly where to update the months. I’m not seeing any cells that use 804 instead of 800. Thanks!
Hello Courtney Hoffman,
How to update it to 800 months:
1. Search for “804” in the worksheet—press Ctrl + F, type 804, and go through each result.
2. Replace each instance of 804 with 800 (your FRA of 66 years 8 months, i.e. 66×12 + 8).
3. This ensures all formulas that calculate based on FRA will now use 800 months.
The main places you’ll find it:
1. The “Total Months” calculation row (Method 2).
2. Any formulas referencing months-based FRA, particularly in cumulative benefit comparisons (Methods 4–6).
Just swapping 804 → 800 in those formulas will adjust the break‑even analysis to reflect your actual FRA.
Let me know if you’d like me to walk through one specific example or cell!
Regards
ExcelDemy