Plotting a vector in Microsoft Excel allows you to visualize the data contained in the vector in the form of a graph or chart. This can be useful for seeing trends and patterns in your data, and can also help you communicate your findings to others more effectively. In this article, I will try to explain step-by-step procedures for plotting vectors in Excel. I hope it will be very helpful for you if you are looking for an efficient way to do so.
Plotting Vectors in Excel: with Easy Steps
In order to plot vectors, we have decided to divide the entire procedure into three major steps. All of them are explained in the following section. Let’s go through the below section to have a clear idea of the topic.
Step 1: Arrange Vectors in Dataset
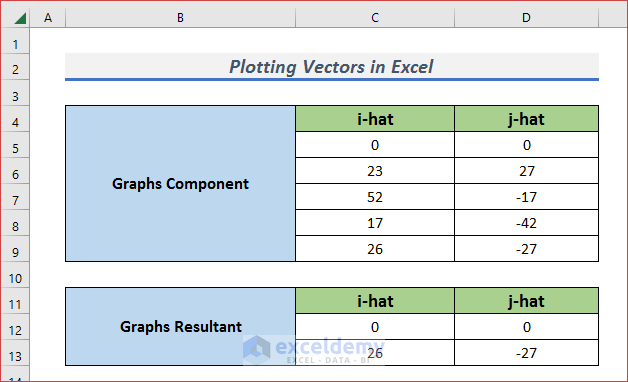
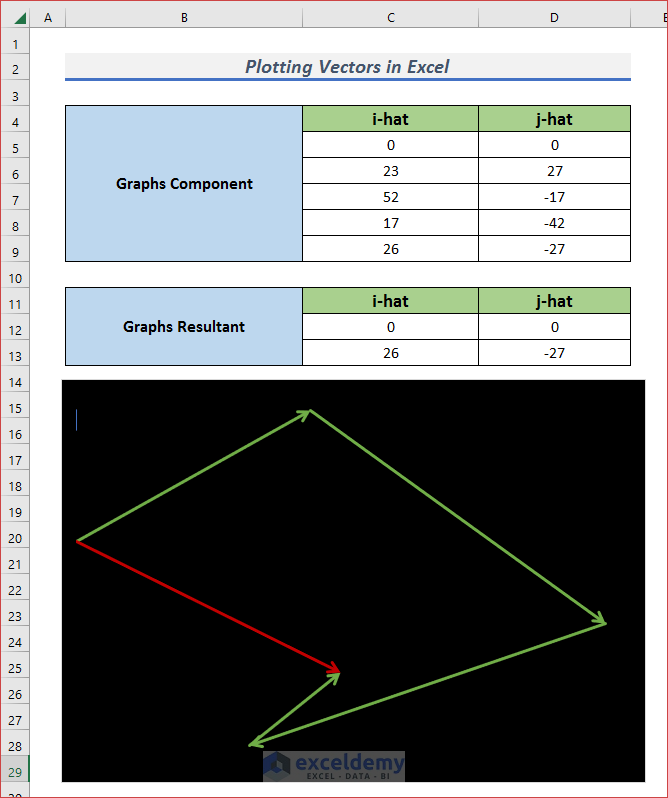
- An organized dataset is a must for plotting vectors in Excel. I have arranged the values along X-axis and Y-axis in the i-hat and j-hat columns.
Step 2: Plot Vectors
- In order to plot vectors, select two values from each i-hat and j-hat column and click on Insert.
- Next, select Insert Scatter (X, Y) or Bubble Chart from the ribbon.

- After that, pick Scatter with Straight Lines from the available options.

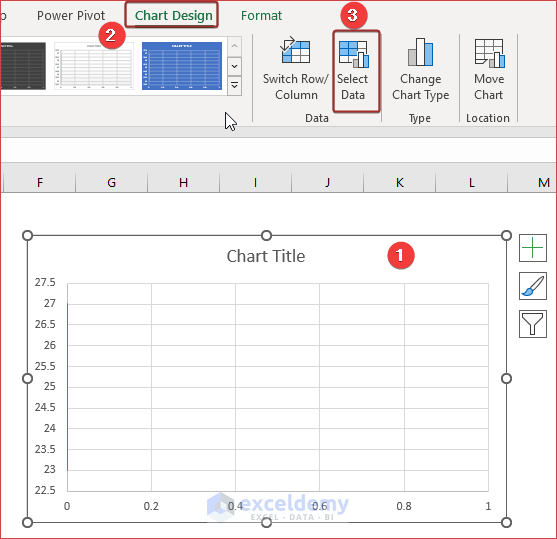
- Followingly, click on the chart and go to the Chart Design tab.
- From the ribbon, pick Select Data.
- A Select Data Source wizard will appear. Click on Add from the Legend Entries (Series) section.

- Now, give a name from Series Name.
- Followingly, define X-axis and Y-axis values from Series X values and Series Y values.
- Afterward, click OK.

- We will have a straight line according to the previously defined conditions.
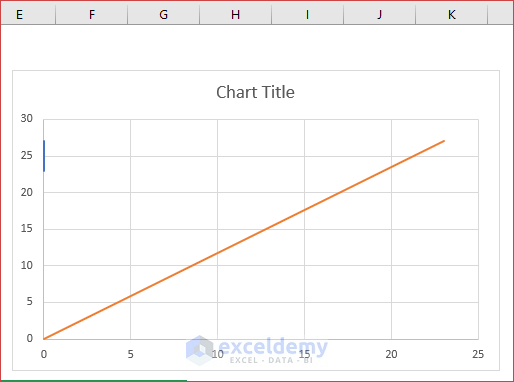
- Similarly, add as many entries as you need.

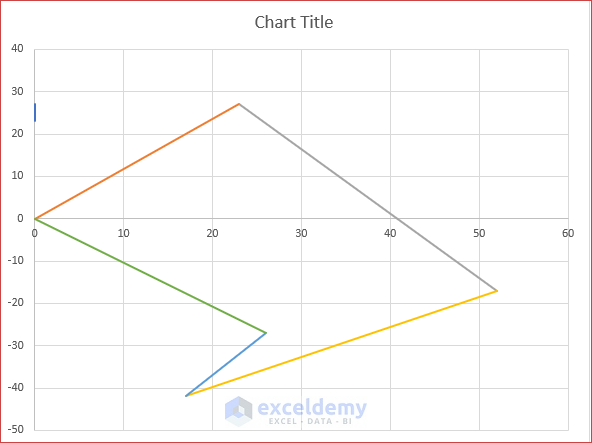
- Thus, we will be able to plot vectors in Excel.
Step 3: Modify Plotted Vectors
- Modification totally depends on the person’s choices. To edit the horizontal graph units, click on the graph line.
- Then, go to Axis Options and set the value from Major.
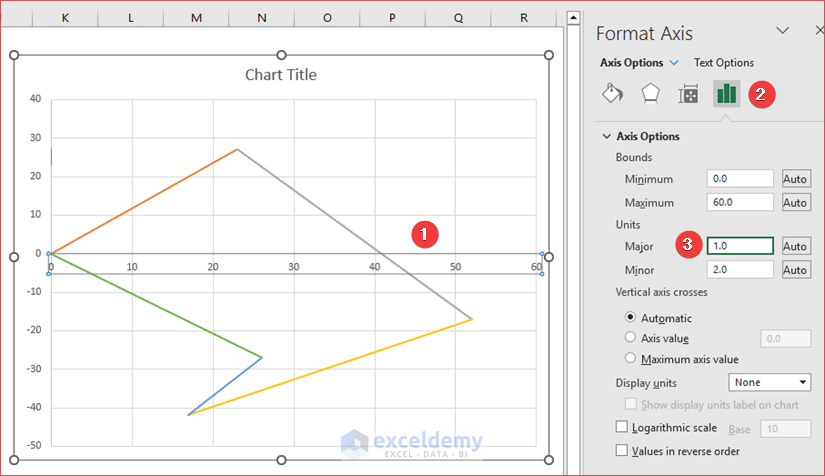
- Similarly, to edit the vertical graph units, click on the vertical graph line and set the value from Major under Axis Options.

- You can delete all the gridlines just by selecting the lines and pressing the Delete key.
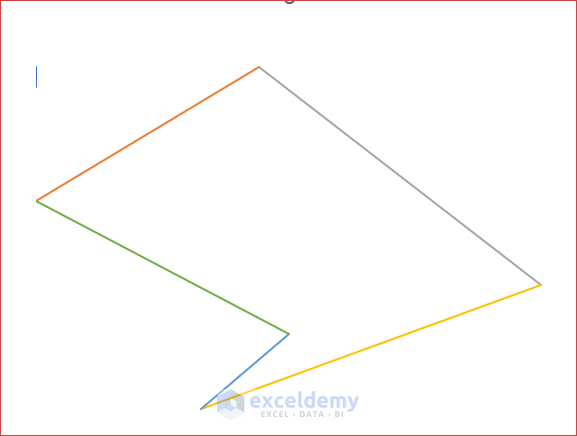
- You can edit the line color, width, and arrow pattern from the Fill & Line option.

- You can even change the background color too.

- Thus, you can plot vectors and modify them according to your choices.
Download Practice Workbook
Download this practice workbook to exercise while you are reading this article.
Conclusion
At the end of this article, I like to add that I have tried to explain step-by-step procedures for plotting vectors in Excel. It will be a matter of great pleasure for me if this article could help any Excel user even a little. For any further queries, comment below. You can visit our site for more articles about using Excel.
<< Go Back to | Vectors in Excel | Excel for Math | Learn Excel
Get FREE Advanced Excel Exercises with Solutions!
