Plotting a vector in Microsoft Excel allows you to visualize the data contained in the vector in the form of a graph or chart. This can be useful for ...
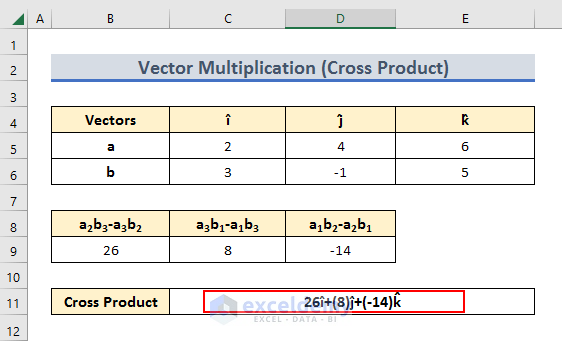
For scientific analysis, we may have to calculate vector multiplication. We can use the Excel spreadsheet for this multiplication. In this article, ...