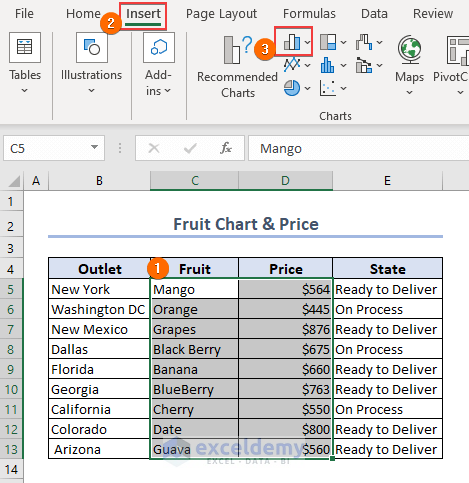
Method 1 – Create the Chart in Excel
- Select the table range C5:D13 and go to Insert Tab >> Chart to create a chart.
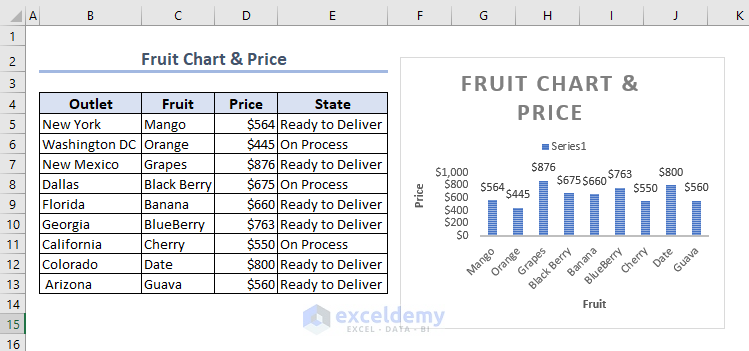
- An Excel Chart is added to the Excel file as below.
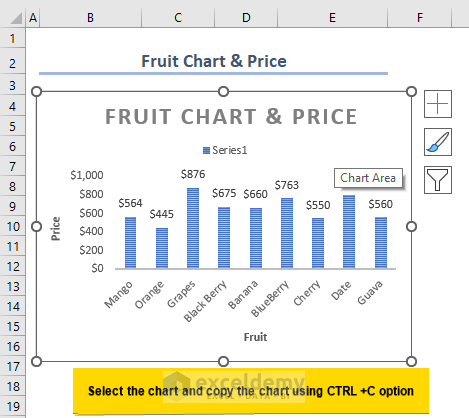
Method 2 – Link the Chart to PowerPoint
In this step, we will link the chart to PowerPoint.
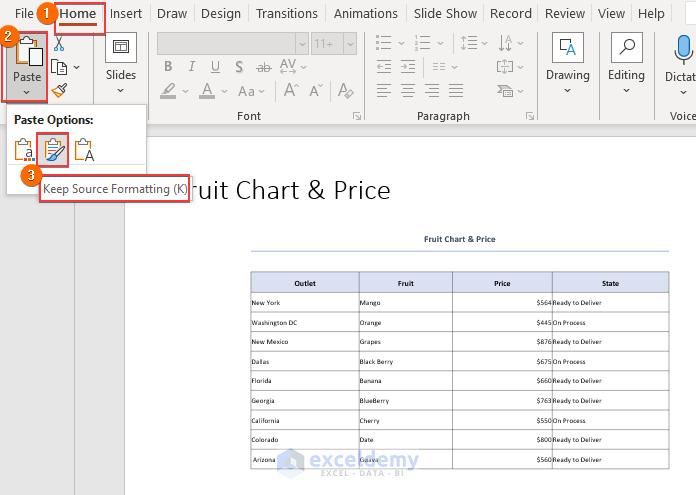
- Open the PowerPoint file and paste the chart using the paste format Keep Source Formatting & Link Data to link the data with the original Excel file.
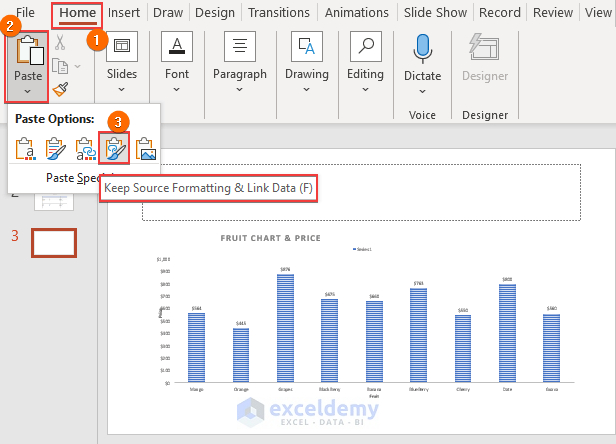
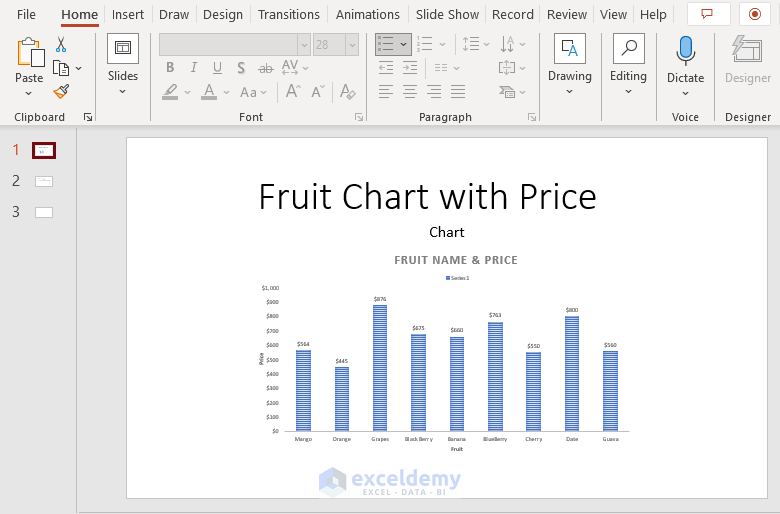
- This is the final output.
How to Link PowerPoint Table to Excel
Link an Excel table to PowerPoint using the same process already shown in the previous method. Instead of using paste format, Keep Source Formatting & Link Data in Paste Format Keep Formatting to paste the table.
How to Update Chart When Auto Update Is Not Working
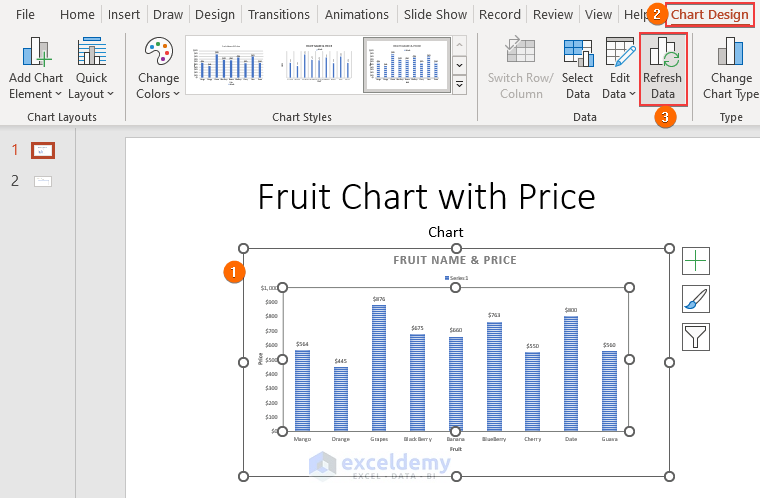
If the data in the chart does not update in PowerPoint after updating the data in Excel, select the chart in PowerPoint and go to Chart Design >> Refresh Data to update the chart when auto-update is working.
What Are the Disadvantages of Linking PowerPoint Chart to Excel?
Linking PowerPoint charts in Excel provides some advantages, but at the same time, there are some disadvantages or drawbacks to applying this method. There are some disadvantages below.
- In the older version of Office, this linking chart process was unreliable.
- When you open the presentation, the data is not auto-updated. You need to refresh the data.
- Existing charts in PowerPoint cannot always be linked. You must select and copy the Excel Chart first.
Things to Remember
- While linking the charts always make sure to select the right paste formatting.
- Always keep the source file accessible otherwise, the other person cannot change the data.
- Sometimes, the auto-update option in PowerPoint is not enabled, so the PowerPoint does not update the data. In that case, you need to enable the option to auto-update.
Frequently Asked Questions
Q1: How do I automatically update Excel charts in PowerPoint?
Ans: If you want to update Excel charts automatically in PowerPoint then link the chart while pasting the chart. Copy the chart and paste the graph using the paste format Keep Source Formatting & Link Data.
Q2: Can a graph automatically update in Excel?
Ans: Excel dynamic charts can be updated automatically but on the other hand, the static chart is not possible to update automatically in Excel whenever there is new data.
Download Practice Workbook
You may down the below workbook for practice.
Related Articles
- How to Copy WhatsApp Group Contacts to Excel
- How to Import Data into Excel from Another Excel File
- How to Paste a List of Emails into Excel
- How to Extract Data from Image into Excel
<< Go Back to Importing Data in Excel | Learn Excel
Get FREE Advanced Excel Exercises with Solutions!
