In this tutorial, I am going to show you 3 simple methods on how to link Excel data to a PowerPoint chart. You can use these methods mainly in large datasets to get any specific data that you want instead of manual copying. Throughout this tutorial, you will also learn some important Excel tools and techniques that will be very useful in any Excel-related task.
Why Do We Need to Link Excel to PowerPoint?
When we link our Excel data to PowerPoint, it changes the data dynamically whenever we change the original Excel file, saving us a lot of work. This is especially very helpful while working with large sets of data. Also, the procedures to create such a link are relatively easy. Otherwise copying and pasting the data manually would take a huge amount of time to complete.
How to Link Excel Data to PowerPoint Chart: 3 Simple Methods
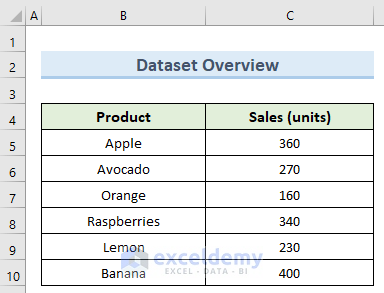
We have taken a concise dataset to explain the steps clearly. The dataset has approximately 7 rows and 2 columns. Initially, we are keeping all the cells in General format. For all the datasets, we have 2 unique columns which are Product and Sales(units). Although we may vary the number of columns later on if that is needed.
1. Linking Entire Excel Worksheet to PowerPoint
In this first method, we will be looking at how to link the entire Excel worksheet to a PowerPoint file. Follow the steps below to do this.
Steps:
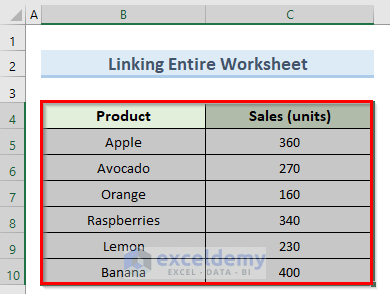
- First, select the data table.
- Then, go to the Insert tab and click on Clustered Column under 2-D Column.
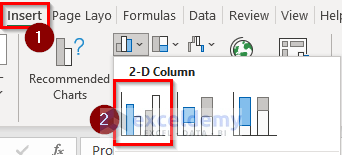
- As a result, this will generate a column chart from the dataset.

- Next, open Microsoft PowerPoint and go to the Home tab at the top of the screen.
- Now, click on the New Slide drop-down and select Blank.

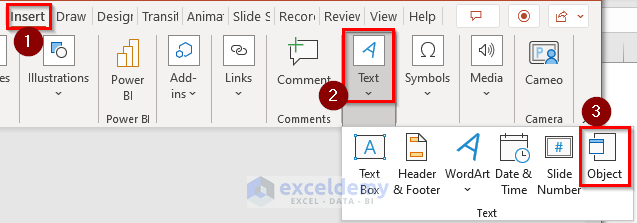
- Then, navigate to the Insert tab and click on Object under Text.
- Next, in the Insert Object window, select Create from file and click on Browse.

- Here, select the excel file that has the worksheet and click on OK.

- After that, check the box Link and click on OK.

- Immediately, this will create a link to your entire worksheet in the PowerPoint file as in the image below.

Read More: How to Embed an Excel File in PowerPoint
2. Using Paste Special to Link Data Section in Excel to PowerPoint
We can also link a specific data section in Excel to PowerPoint using the Paste Special option. Below are the steps to achieve this.
Steps:
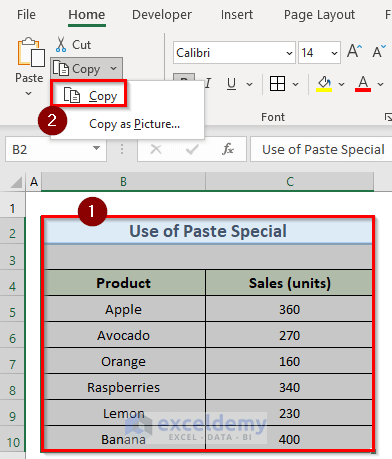
- To begin with, select the cells from B2 to C10 which has the dataset.
- Next, navigate to the Home tab and select Copy.
- Now, open PowerPoint and go to the Home tab at the top of the screen.
- Under this tab, select Paste and click on Paste Special.

- Next, in the Paste Special window, select Paste link.
- Then, select the worksheet object and click on OK.

- Finally, this will link the Excel dataset that you selected inside the PowerPoint file which will also change dynamically.

Read More: [Fixed!] Problems with Embedded Excel Files in PowerPoint
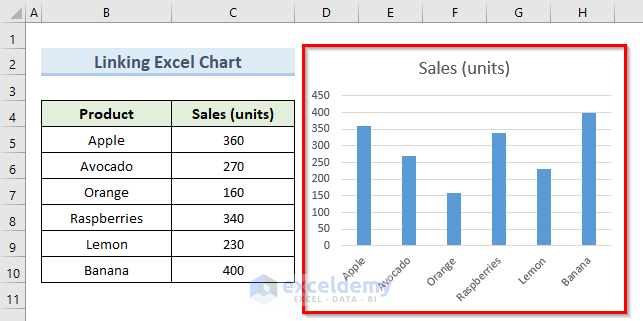
3. Linking Excel Chart to PowerPoint
If you want to link only the chart section from Excel to PowerPoint, then you can do that by following the steps below.
Steps:
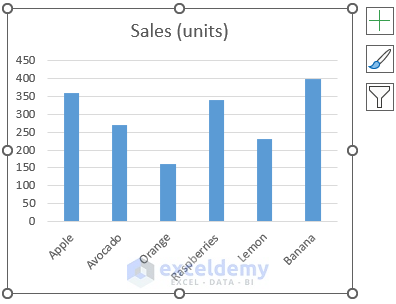
- To start with, select the chart in Excel copy using Ctrl+C.
- After that, open PowerPoint and go to the Home tab as before.
- Now, under the Paste drop-down, click on Keep Source Formatting and Link Data.

- Consequently, this will paste the chart with the link to the original Excel file.
Read More: [Solved] Embedded Excel in PowerPoint Not Showing All Data
Things to Remember
- Moving the Excel file to another folder while PowerPoint is closed will break the link between them.
- If you add a new row or column in the Excel file, this may not update in the PowerPoint.
- If you email the two files, the link may break for the recipient.
- Linking in this way does not work for data within textboxes and shapes.
Download Practice Workbook
You can download the practice workbook from here.
Conclusion
I hope that you were able to apply the methods that I showed in this tutorial on how to link Excel data to a PowerPoint chart. As you can see, there are quite a few ways to achieve this. So wisely choose the method that suits your situation best. If you get stuck in any of the steps, I recommend going through them a few times to clear up any confusion. If you have any queries, please let me know in the comments.
Related Articles
- How to Link Excel Sheets to PowerPoint
- How to Open Existing PowerPoint File from Excel VBA
- How to Link Powerpoint to Excel for Dynamic Data Updates
<< Go Back to Excel to PowerPoint | Export Data from Excel | Learn Excel
Get FREE Advanced Excel Exercises with Solutions!
