The F test is used to determine if two sample groups have similar variances.
Download Practice Workbook
Download the workbook.
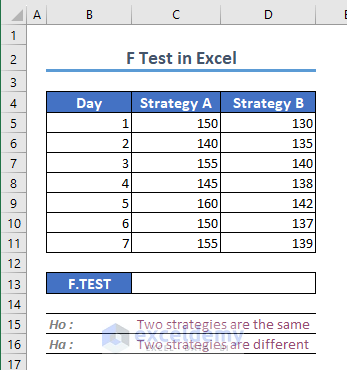
Compare the performance of two different marketing strategies (Strategy A and Strategy B) based on the number of website visits they generate over a week. Test if there is a significant difference in the average website visits for these two strategies (Ha: alternative hypothesis) or if they are the same (Ho: null hypothesis).
Method 1 – Using the Data Analysis Toolpak
- Go to the Data tab and select Data Analysis.
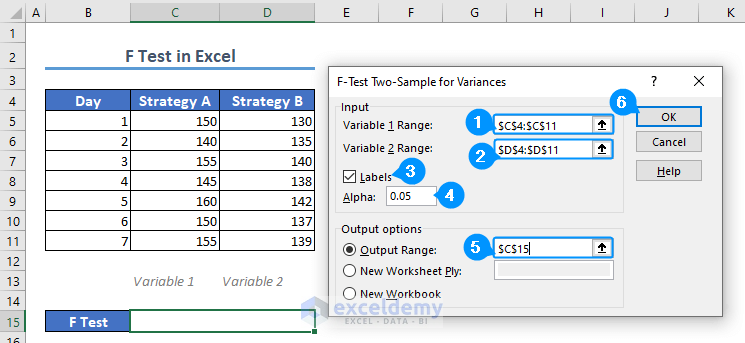
- In the Data Analysis window, select F-test Two Sample for Variance and click OK.
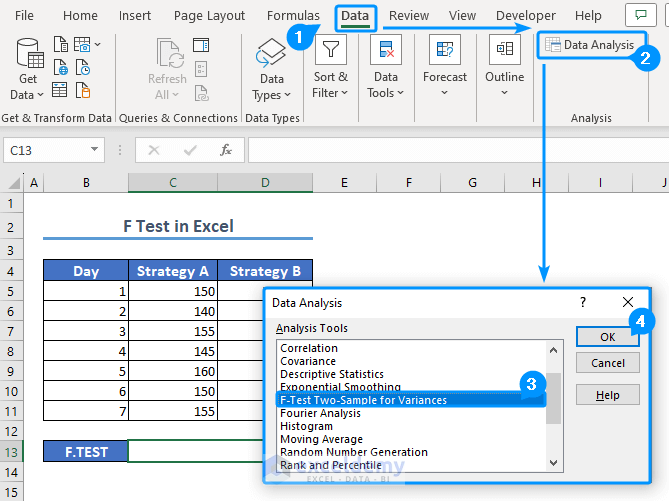
A new window will be displayed.
- Enter data and it will automatically calculate the result.
Before selecting the variable range, calculate the variance for each dataset using the VAR.S function (Excel requires the highest variance to be designated as variable 1 range).
- For Strategy A, use the following formula.
=VAR.S(C5:C11)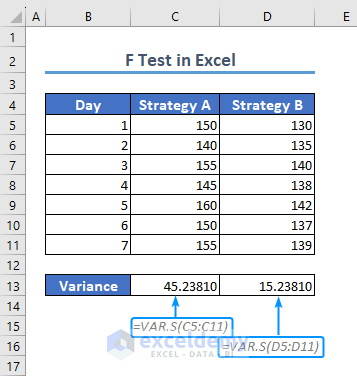
- Strategy A possesses the highest variance. So, input Strategy A as Variable 1 Range, and Strategy B as Variable 2 Range.
- Check Labels.
- Set the significance level (alpha) to 0.05.
- There are three output options. Choose the output range $C$15.
- Click OK to see the result.
The Analysis ToolPak will display the outcome.
It provides the mean, variance, observation count, degrees of freedom (df), F value, F critical value, and P value.
To determine the P value for the F test, you need the F value and the F critical value. When the calculated P value exceeds the chosen significance level (alpha), accept the null hypothesis: there isn’t a significant difference between the strategies.
If the P value is lower than alpha, accept the alternative hypothesis: there is a distinction between the two strategies.
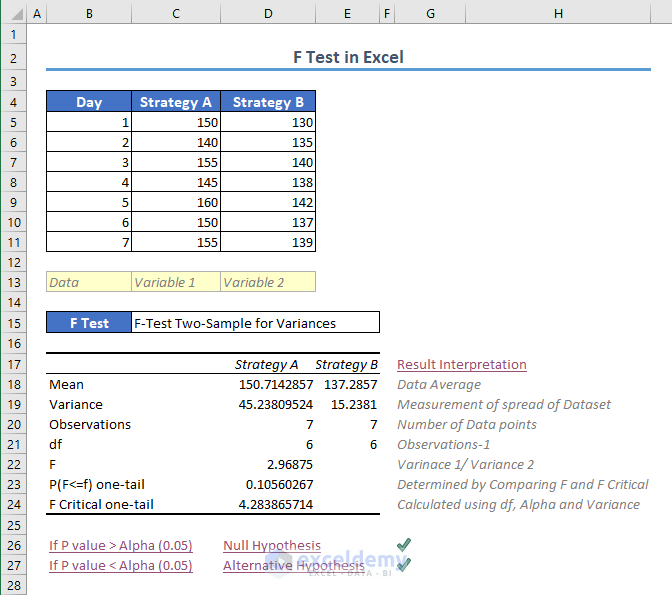
Since the P value is greater than the chosen significance level (0.05), you can conclude that the average website visits for the two strategies are statistically considered equal. There is no significant difference in the mean website visits between Strategy A and Strategy B.
Method 2 – Using the F.TEST Function
- Select C13 and use the following formula.
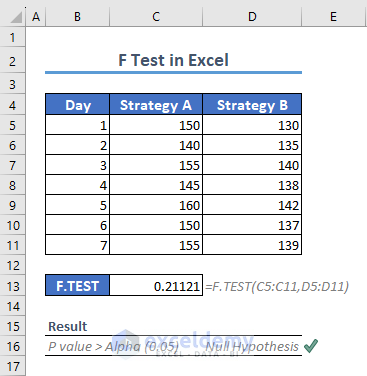
=F.TEST(C5:C11,D5:D11)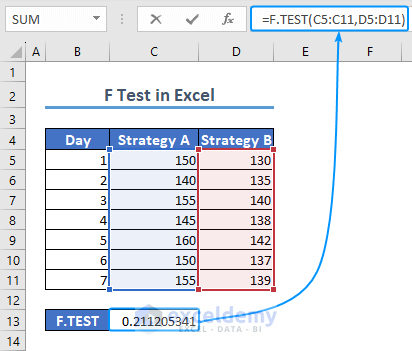
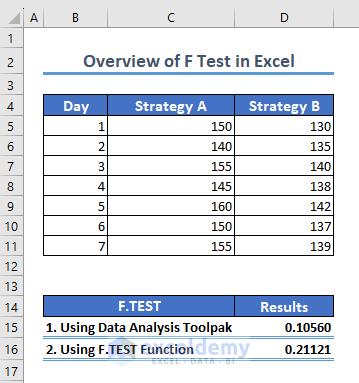
The result is 0.21121.
Since the p-value (0.21121) exceeds the significance level (0.05), the result is not considered statistically significant. Therefore, we cannot reject the null hypothesis.
There is no substantial difference in the average number of website visits between Strategy A and Strategy B.
How to Activate the Data Analysis Toolpak Add-in in Excel
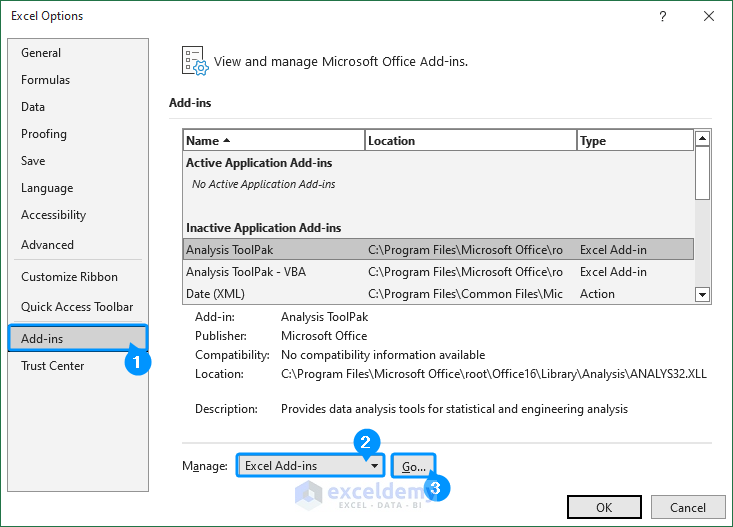
- Click the File tab.
- Select Options.
- In the Excel Options window, choose Add-Ins.
- In Manage, select Excel Add-ins.
- Click Go… .
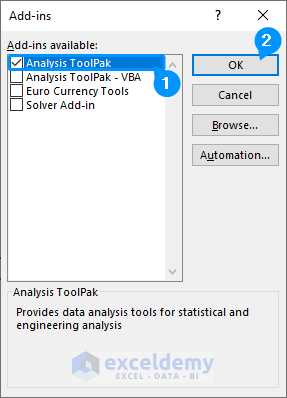
- In the Add-Ins window, check Analysis ToolPak.
- Click OK.
Data Analysis is displayed in the Data tab on the ribbon.
Things to Remember
- Set the Significance Level: Determine your significance level (commonly 0.05) before interpreting the p-value.
Frequently Asked Questions
Q1. What is the formula for the F-test?
The formula for the F-test depends on the context. To compare two variances (two-sample F-test), the formula is:
F = Variance1 / Variance2
In ANOVA, which compares multiple means, the formula involves calculating the ratio of group variance.
Q2. What is the difference between a one-sample and a two-sample F-test?
A one-sample F-test assesses the variance in a single sample with a fixed value, whereas a two-sample F-test evaluates the variances in two separate samples.
<< Go Back to Excel for Statistics | Learn Excel
Get FREE Advanced Excel Exercises with Solutions!
