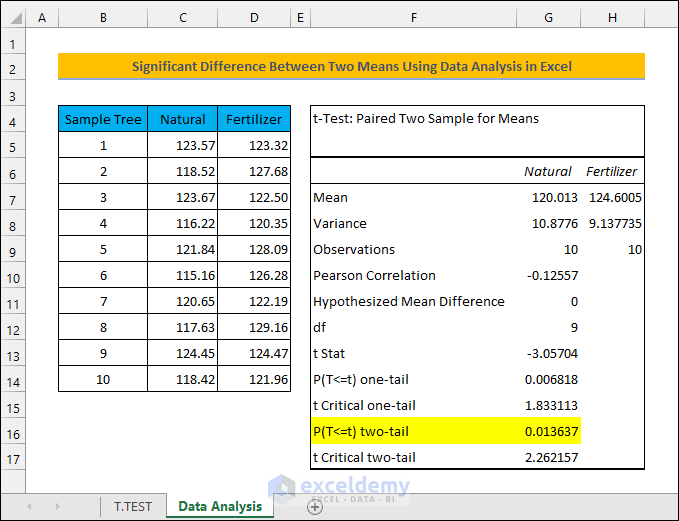
The following picture highlights calculating the difference between means.
What Is the Significant Difference and T-Test?
Significant Difference:
The significant difference simply means that two sets of data are significantly different. In statistics, we consider that there is a 5% probability of this happening by chance. If this is not the case then the datasets are different. A Null Hypothesis assumes that two means are the same. Now, a p-Value (probability) of less than 0.05 rejects this hypothesis. This way, we can conclude that the two sets of data or means are different and not the same.
T-Test:
A T-Test compares two data populations and their means. The test is used to see if the two sets are significantly different from one another. A Null Hypothesis is used to test for the significant difference. In addition, the datasets usually follow the normal distribution curve. However, the variances are unknown and assumed to be equal.
William Sealy Gosset devised the T-Test in around 1908 while working at the Guinness Brewery in Ireland. He used the T-Test to monitor the quality of the stout brewed by Guinness. A T-test analysis could be used to test the results from two different portfolios that are managed under two different investment strategies. In this analysis, a Null Hypothesis can be created, for instance, where the means of the returns for the two portfolios do not differ. The test then looks at the T-Statistic and T-Distribution to determine a p-Value (probability) that can be used to either validate or refute the Null Hypothesis. The T-Test is one of several different types of statistical tests used for hypothesis testing. Others include an Analysis of Chi-Square Test, F-Test, Variance Test, and Z-Test. The T-Test is considered a more conservative approach and better suited for smaller groups of data.
How to Calculate the Significant Difference Between Two Means in Excel
Imagine you have an orange orchard with 10 trees. You want to find out if using chemical fertilizer will increase the weight of the oranges. You measure the average weight of the oranges from each of the trees before fertilizing. Then, you do the same in the next season after applying fertilizer. Here are the measurements.
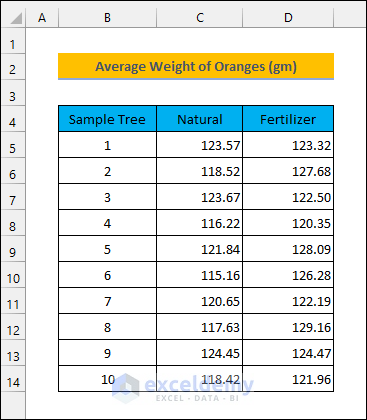
It seems that using fertilizers has increased the average weight of the oranges. But you can’t be sure if this was just by chance without calculating the significant difference. That’s where the significant difference comes in.
Method 1 – Calculate the Significant Difference with the T.TEST Function
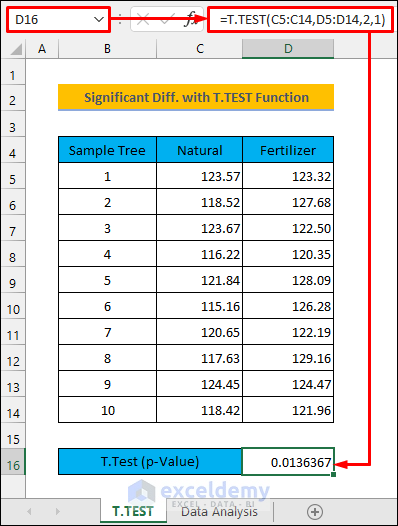
- Enter the following formula in cell D16.
=T.TEST(C5:C14,D5:D14,2,1)The formula returns a p-value of less than 0.05. Therefore, we can say that using chemical fertilizers has increased the weight of the oranges.
How Does the Formula Work?
The T.TEST function has four arguments. You need to enter them properly to avoid faulty results.
Syntax:
Arguments:
array1: Refers to the first range of data.
array2: Refers to the second range of data.
tails: Enter 1 for One-tailed distribution and 2 for Two-tailed distribution. One-tailed distribution allows for effect in one particular direction, either positive or negative, good or bad while two-tailed distribution allows both.
type: Enter 1 for Paired, 2 for Two-sample equal variance (homoscedastic), and 3 for Two-sample unequal variance (heteroscedastic). Paired type indicates that the datasets are from two dependent or related or the same sources. Use Two-sample equal variance for two independent datasets with equal variances and Two-sample unequal variance for unequal variances.
Method 2 – Calculate the Significant Difference Using Data Analysis in Excel
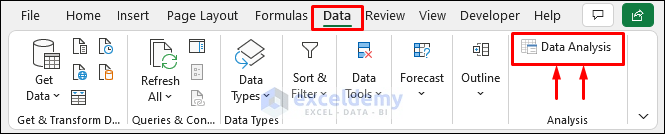
- Select the Data tab to see if your Excel has the Analysis ToolPak installed.
- If you don’t see the Data Analysis feature, press Alt + F + T to open the Excel Options window.
- Go to the Add-ins tab.
- Select Go as shown in the picture below.
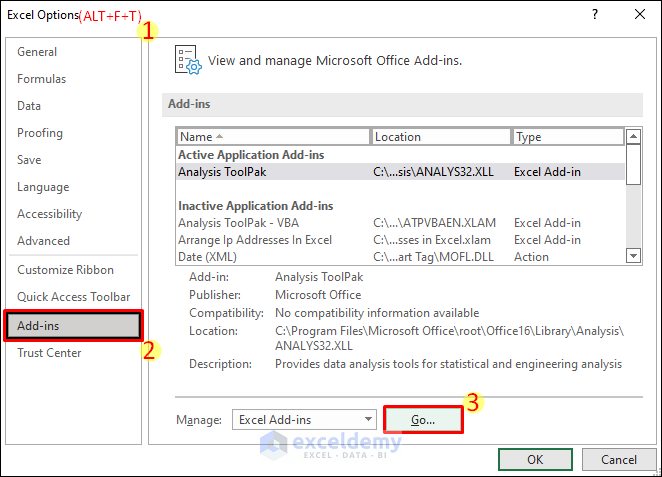
- Check the checkbox for Analysis ToolPak on the Add-ins window.
- Select OK. After that, you will be able to access the Data Analysis feature from the Data tab.

- Select Data and choose Data Analysis. This will open the Data Analysis window.
- Choose the proper analysis tool from the list. We will select t-Test: Paired Two Sample for Means for our dataset.
- Select OK. This will take you to that analysis tool window.

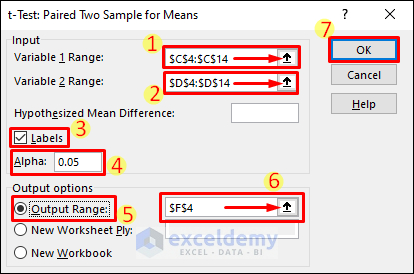
- Enter $C$4:$C$14 and $D$4:$D$14 for Variable 1 Range and Variable 2 Range, respectively, using the selection arrows.
- Check Labels. You could keep this unchecked if you did not include the headers in the above step.
- Enter 0.05 in the textbox for Alpha.
- Mark the radio button for Output Range.
- Select the location where you want to get the results. Excel shows the results in a new worksheet by default.
- Select OK.
- The highlighted value indicates the same result obtained in the earlier method.
Things to Remember
- Make sure you are using the proper arguments that correspond to your dataset while using the function. Otherwise, you might end up with erroneous results.
- Select the proper analysis tool based on your dataset while using the Data Analysis window.
- The TTEST function is the earlier version of the T.TEST function.
Download the Practice Workbook
<< Go Back to Excel for Statistics | Learn Excel
Get FREE Advanced Excel Exercises with Solutions!
