Download the Practice Workbook
T Test Types
There are two types of t-tests. They are:
- One-tailed t-test
- Two-tailed t-test
Each of them has 3 subtypes. They are:
- Paired
- Two sample equal variance
- Two sample unequal variance
How to Do a T-Test in Excel: 2 Effective Ways
Method 1 – Using the Excel T.TEST Or TTEST Function For a T-Test
Case 1.1 – Two Sample Equal Variance T-Test
In the dataset, you will see the prices of different laptops and smartphones. Here is a formula that performs a T-Test on the prices of these products and returns the t-test result.
=T.TEST(B5:B14,C5:C14,2,2)
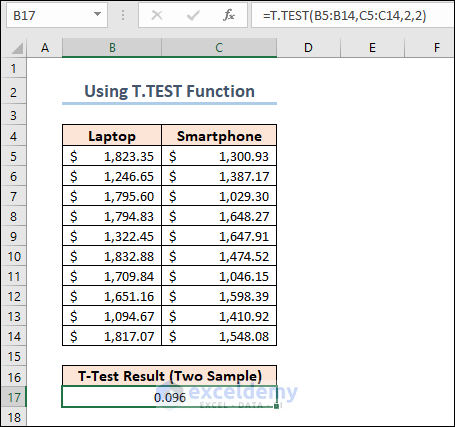
We set the 3rd argument of the function to 2 as we are doing a two-tailed t-test on the dataset. The 4th argument should be 2 for a two-sample equal variance t-test.
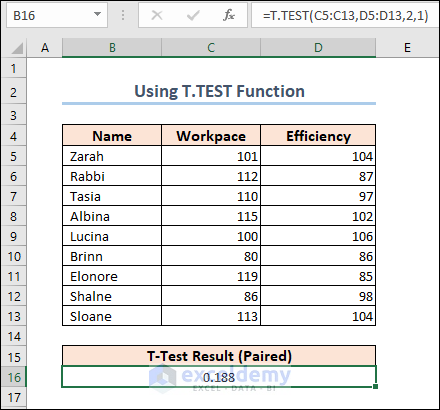
Case 1.2 – Paired T-Test
We are going to apply another formula to calculate the Paired T-Test. The following dataset shows the performance mark of some employees in two different criteria.
=T.TEST(C5:C13,D5:D13,2,1)
Note: The explanation of the results is described in the following sections.
Method 2 – Using the Analysis ToolPak
- Go to the Options window.
- Select Add-ins and click on the Go button in the Manage section.
- Click OK.

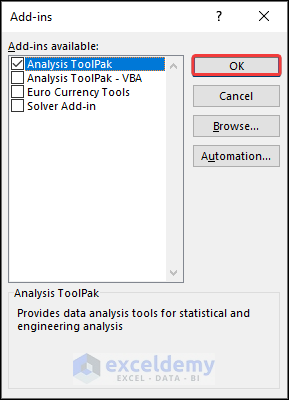
- The Add-ins window will appear. Select Analysis ToolPak and click OK again.
Case 2.1 – Tw-Sample Equal Variance T-Test
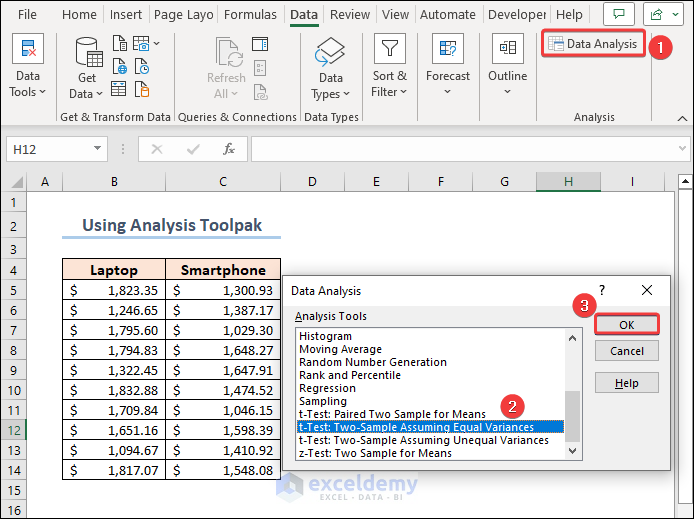
- Click on the Data Analysis button from the ribbon of the Data tab.
- The Data Analysis features will appear. Select t-Test: Two Sample Assuming Equal Variances and click OK.
- Set up the parameters for the t-test operation. Insert the Laptop and Smartphone prices as Variable 1 Range and Variable 2 Range. Include the headings in the range and check Labels.
- Set the value of Hypothesized Mean Difference to 0.
- Select an Output option of your preference and click OK.
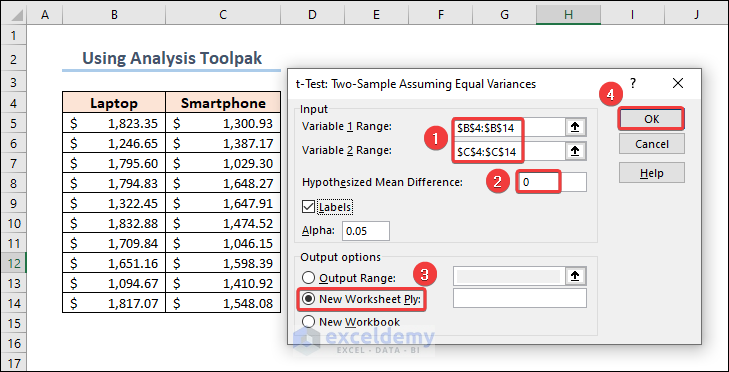
- As we have chosen a New Worksheet for the outputs, we will see the results in a new sheet.
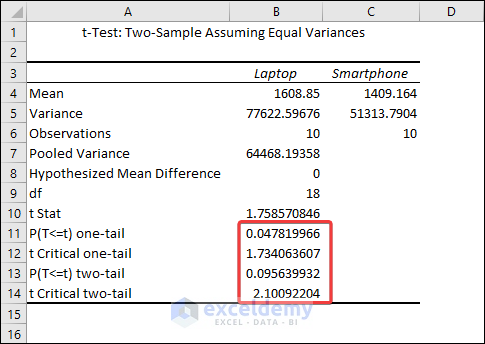
Comments on Results
The output shows that the mean values for Laptops and Smartphones are 1608.85 and 1409.164 respectively. We can see from the Variances row that they are not precisely equal, but they are close enough to be assumed to have equal variances. The most relevant metric is the p-value.
The difference between means is statistically significant if the p-value is less than your significance level. Excel calculates p-values for one- and two-tailed T Tests.
One-tailed T Tests can detect only one direction of difference between means. A one-tailed test, for example, might only evaluate whether Smartphones have higher prices than Laptops. Two-tailed tests can reveal differences that are larger or smaller than. There are some other disadvantages to utilizing one-tailed testing, so I’ll continue with the conventional two-tailed results.
For our results, we’ll utilize P(T=t) two-tail, which is the p-value for the t-test’s two-tailed version. We cannot reject the null hypothesis because our p-value (0.095639932) is greater than the conventional significance level of 0.05. The hypothesis that the population means differ is supported by our sample data. The mean price of Laptops is greater than the mean price of Smartphones’.
The Analysis ToolPak also returns results for a one-tailed t-test. Here, the one-tailed P value of the two-sample equal variance t-test is 1.734.
Case 2.2 – Paired T-Test
Select the t-Test: Paired Two Samples for Mean when you open the Data Analysis window.
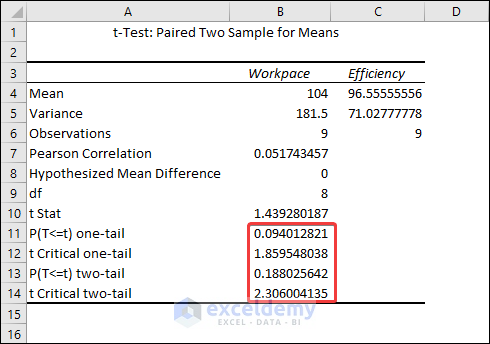
Comments on Results
The result shows that the mean for the Workpace is 104 and the mean for the Efficiency is 96.56.
The difference between means is statistically significant if the p-value is less than your significance level. For our results, we’ll utilize P(T=t) two-tail, which is the p-value for the t-test’s two-tailed version. We cannot reject the null hypothesis because our p-value (0.188) is greater than the conventional significance level of 0.05. The hypothesis that the population means differ is supported by our sample data. In particular, the Workpace mean exceeds the Efficiency mean.
How to Interpret T-Test Results in Excel
Let’s bring out the results again.
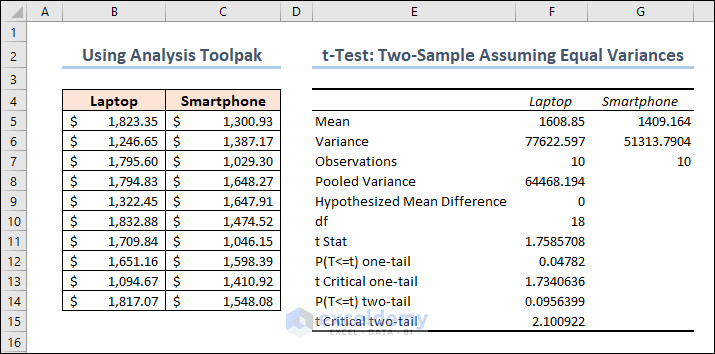
i. Mean:
- The mean of laptop prices = 1608.85
- The mean of smartphone prices = 1409.164
ii. Variance
- The variance of laptop prices = 77622.597
- The variance of smartphone prices = 51313.7904
iii. Observations
The number of observations for both laptops and smartphones are 10.
iv. Pooled Variance
The samples’ average variance, calculated by pooling the variances of each sample.
The mathematical formula for this parameter is:
((No of observations of Sample 1-1)*(Variance of Sample 1) + (No of observations of Sample 2-1)*(Variance of Sample 2))/(No of observations of Sample 1 + No of observations of Sample 2 – 2)
So it becomes: ((10-1)*77622.59676+(10-1)*51313.7904)/(10+10-2) = 64468.19358
v. Hypothesized Mean Difference
We “hypothesize” that the number is the difference between the two population means. In this situation, we chose 0 because we want to see if the difference between the means of the two populations is zero.
vi. df
It indicates the value of the Degrees of Freedom. Formula for this parameter is:
No of observations of Sample 1 + No of observations of Sample 2 – 2 = 10 + 10 – 2 = 18
vii. t-Stat
The test statistic value of the t-Test operation.
The formula for this parameter is given below.
(Mean of Sample 1 – Mean of Sample 2)/(Square root of (Pooling Variance* (1/No of observations of Sample 1 + 1/No of observations of Sample 2)))
So it becomes: (1608.85 – 1409.164)/Sqrt(64468.19358 * (1/10 + 1/10)) = 1.758570846
viii. P(T<=t) two-tail
A two-tailed t-test’s p-value. This value can be found by entering t = 1.758570846 with 18 degrees of freedom into any T Score to P Value Calculator.
In this situation, the value of p is 0.095639932. Because this is greater than 0.05, we cannot reject the null hypothesis. This suggests that we lack adequate evidence to conclude that the two population means differ.
ix. t-Critical two-tail
This is the test’s crucial value. A t-Critical value Calculator with 18 degrees of freedom and a 95% confidence level can be used to calculate this number.
In this instance, the critical value is 2.10092204. We cannot reject the null hypothesis because our test statistic t is less than this number. Again, we lack adequate information to conclude that the two population means are distinct.
Things to Remember
- Excel demands that your data be arranged in columns, with data from each group in a separate column. The first row should have labels or headers.
- Clearly state your null hypothesis (usually that there is no significant difference between the group means) and your alternative hypothesis (the opposite of the null hypothesis).
- As a result of the t-test, Excel returns the p-value. A small p-value (usually less than the specified alpha level) indicates that the null hypothesis may be rejected and that there is a substantial difference between the group means.
Frequently Asked Questions
Can I perform a t-test on unequal sample sizes in Excel?
Yes, you can use the T.TEST function to do a t-test on unequal sample sizes. When calculating the test statistic, Excel automatically accounts for unequal sample sizes.
What is the difference between a one-tailed and a two-tailed t-test?
A one-tailed t-test determines if the means of the two groups differ substantially in a given direction (e.g., greater or smaller). A two-tailed t-test looks for any significant difference, regardless of direction.
Can I calculate the effect size in Excel for t-tests?
While there is no built-in tool in Excel to calculate effect size, you can manually compute Cohen’s d for independent t-tests and paired sample correlations for paired t-tests using Excel’s basic mathematical operations.
<< Go Back to Excel for Statistics | Learn Excel
Get FREE Advanced Excel Exercises with Solutions!
