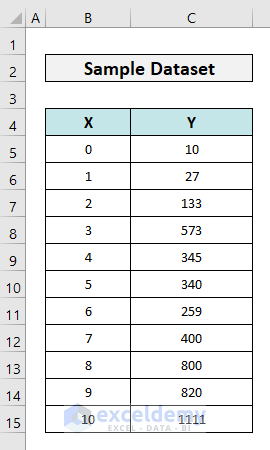
The following dataset shows some coordinates of a random curve.
Step 1 – Set Data Properly and Create Scatter Chart
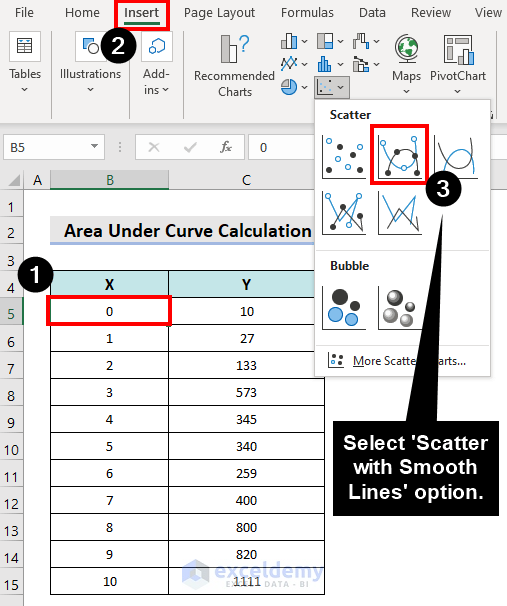
- Set your data in order and select any cell of your data. Go to the Insert tab and from the Charts group, select a suitable chart type.
- We have selected the Scatter with Smooth Lines and Markers option.
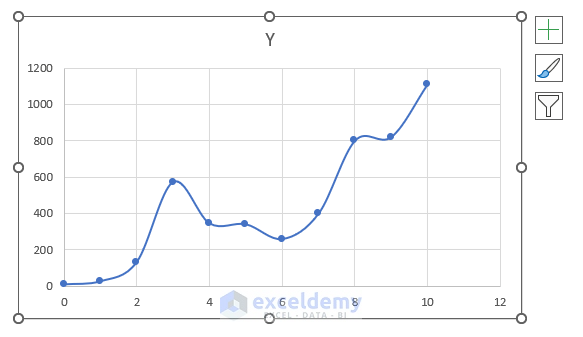
- The scatter chart will be inserted.
Step 2 – Enable Trendline and Its Equation
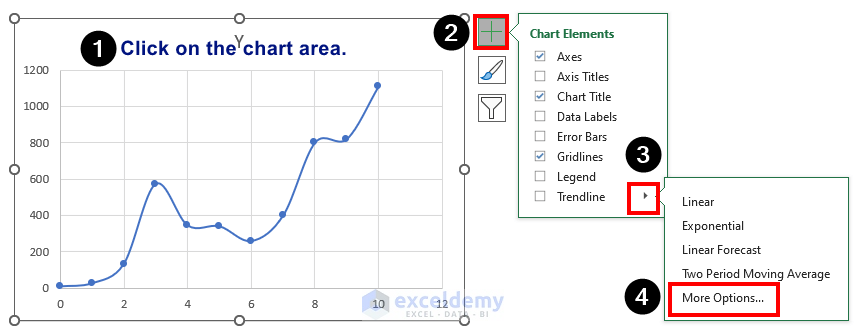
- Click on the Chart Area.
- Click the Chart Elements button.
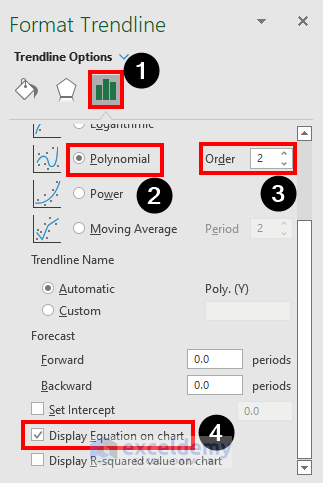
- From the Trendline dropdown, select More Options.
The Format Trendline window will appear.
- Click on the Polynomial and check the Display Equation on chart checkbox.
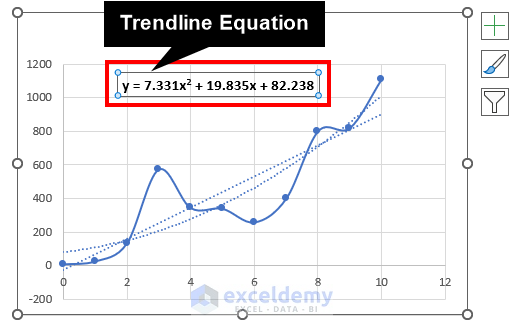
The following trendline equation will appear on the chart area.
Y = 7.331X2 + 19.835X + 82.238
Step 3 – Find the First Integral and Calculate Area Under Curve
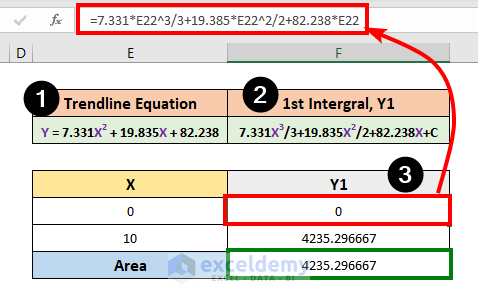
- Create a table and insert the following formula in cell F24.
=F23-F22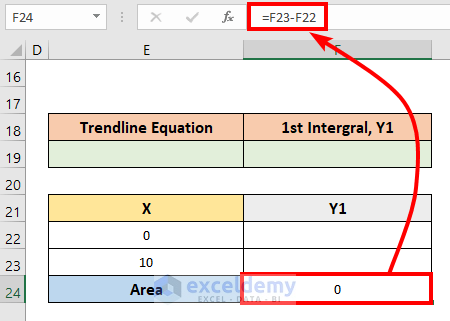
- Copy the trendline equation and paste it into cell E19.
- Calculate the first integral with this equation using the following formula.
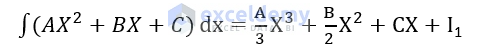
The first integral of Y is-
Y1 = 7.331X3/3 + 19.835X2/2 + 82.238X+C
- Enter the following formula (or match it with your data) in cell F22 and copy it with the fill handle in cell F23.
=7.331*E22^3/3+19.385*E22^2/2+82.238*E22- The area is calculated in cell E24.
Note:
The area under the curve is with respect to the X-axis. If you want to find the area under the curve with respect to the Y axis, flip the data horizontally, switch the axes and apply all the steps described.
How to Calculate Area Under Curve in Excel Using Trapezoidal Rule
Steps:
- Insert the following formula in cell D5 and press Enter.
=((C6+C5)/2)*(B6-B5)- Drag the fill handle icon to cell D14. Leave the last as it is.
- Insert the following formula in cell D16.
=SUM(D5:D15)- Press Enter.
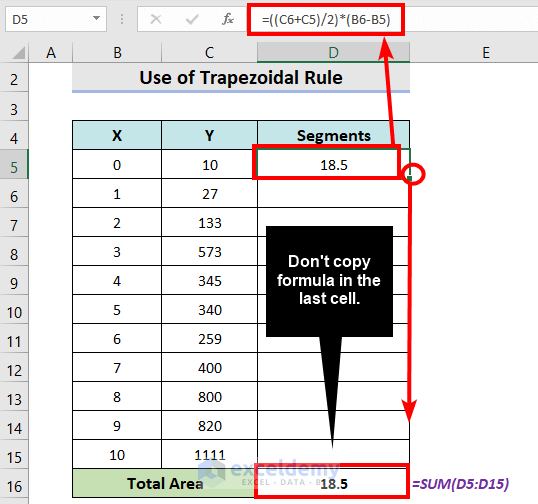
- It will output the value of area under curve.
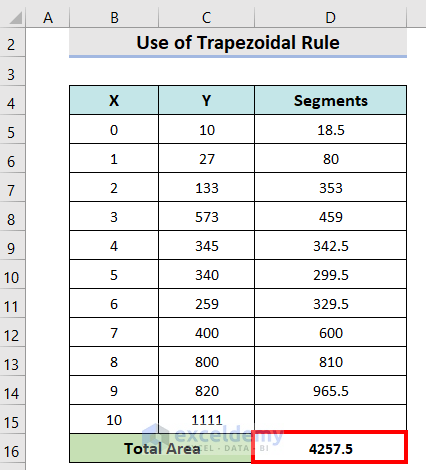
Note:
More coordinates in the same range with smaller intervals will give a more accurate result.
Download Practice Workbook
<< Go Back to | Calculus in Excel | Excel for Math | Learn Excel
Get FREE Advanced Excel Exercises with Solutions!
