Method 1 – Utilize Data Labels of Excel Graph to Convert Decimal Places
STEPS:
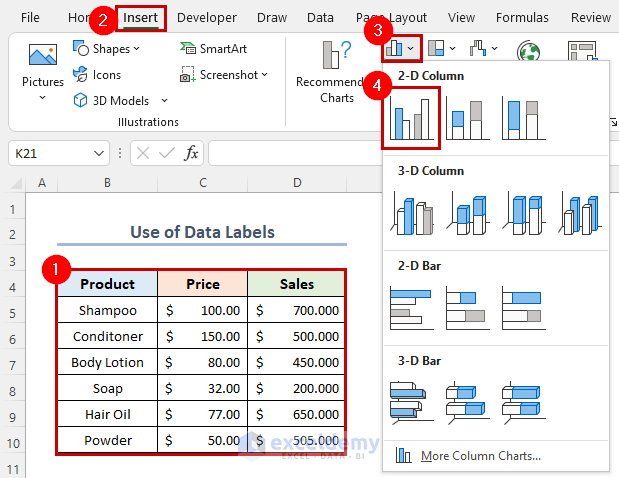
- Insert the graph. For this, select the data.
- Go to the Insert tab from the ribbon.
- Click the Insert Column or Bar Chart drop-down menu under the Charts group.
- Select the Clustered Column under the 2-D Column option.
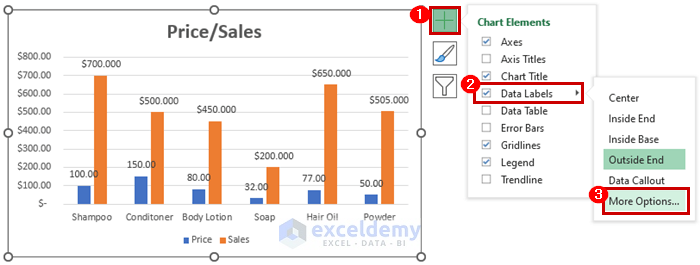
- The graph will be displayed on your sheet. We have added a title to the graph.
- Click on the graph and go to the Chart Elements.
- Go to Data Labels and select More Options.
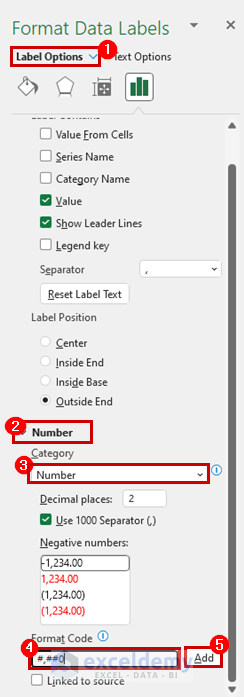
- The Format Data Labels dialog will appear on the right side of your sheet.
- Go to Label Options and click on Number.
- Select Number from the Category menu.
- Change the Format Code (#,##0).
- Click on the Add button.
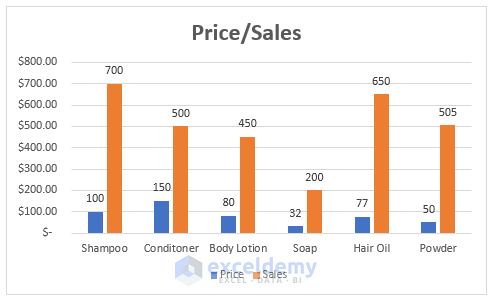
- You can see the decimal places will change in your Excel graph.
Method 2 – Use of Format Cells Feature to Change Decimal Places
STEPS:
- Insert the graph.
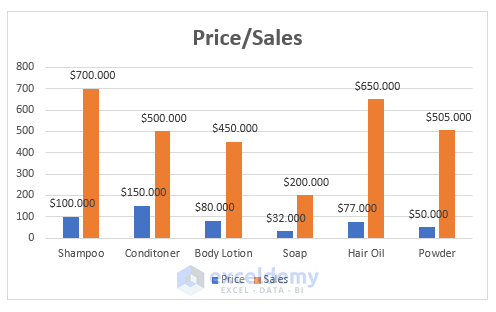
- Select the data that have decimal places.
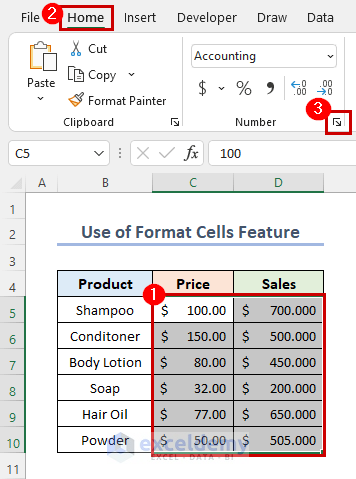
- Go to the Home tab from the ribbon.
- The Format Cells dialog box, click on the tiny icon under the Number category.
- Use the keyboard shortcut CTRL+1 to display the Format Cells dialog box.
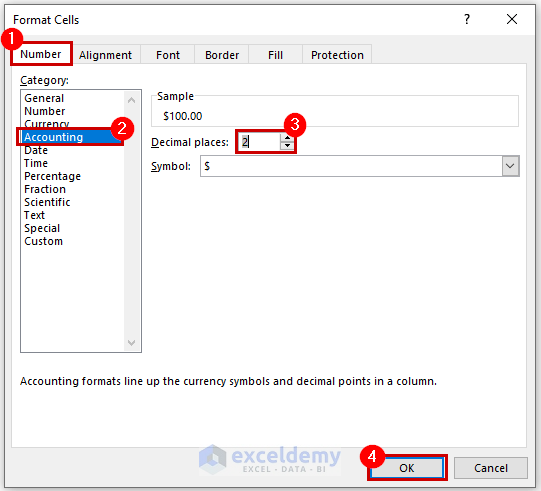
- The Format Cells dialog box will appear.
- Go to the Number menu and select Accounting (as we use Price & Sales).
- Change the Decimal places; in our case, we change 2 decimal places. and click OK.
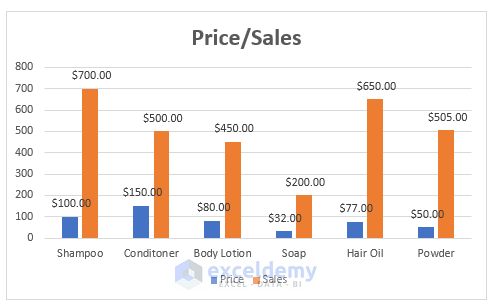
- This will automatically change the decimal places in Excel graphs.
Method 3 – Apply VBA to Commute Decimal Places in Excel Graph
STEPS:
- Incorporate the graph.
- Go to the Developer tab from the ribbon.
- Click on Visual Basic from the Code category to open the Visual Basic Editor. Or press ALT+F11 to open the Visual Basic Editor.
- Click on Module from the Insert drop-down menu bar.
- This will create a Module in your workbook.
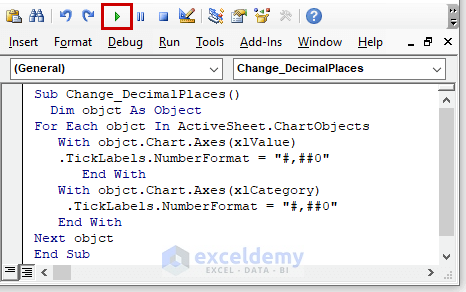
- Copy and paste the VBA code shown below.
VBA Code:
Sub Change_DecimalPlaces()
  Dim objct As Object
For Each objct In ActiveSheet.ChartObjects
   With objct.Chart.Axes(xlValue)
   .TickLabels.NumberFormat = "#,##0"
      End With
   With objct.Chart.Axes(xlCategory)
    .TickLabels.NumberFormat = "#,##0"
   End With
Next objct
End Sub- Run the code by clicking the RunSub button or pressing the keyboard shortcut F5.
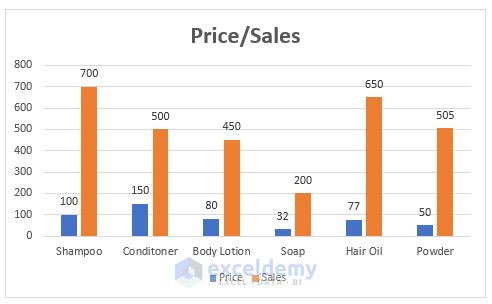
- Following the steps will change the decimal places in your Excel graph.
How to Configure Excel to Automatically Place Decimal Points
STEPS:
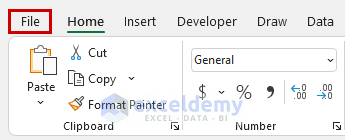
- Go to the File tab.
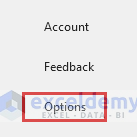
- This will take you backstage to the Excel menu.
- Click on Excel Options.
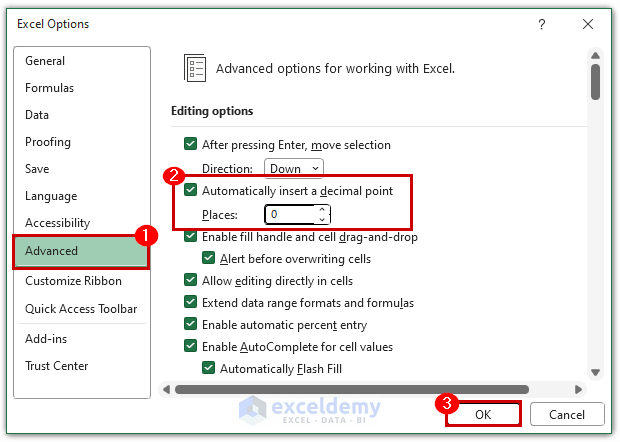
- From the Excel Options, click on Advanced.
- Scroll to the Editing options and checkmark the Automatically insert a decimal place.
- Select your preferred decimal place.
- Click on OK.
- Whenever you insert any decimal places in your workbook, this will automatically show the place you have changed.
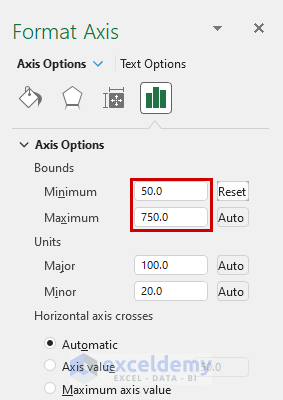
How to Change Axis Scale in Excel Graph
STEPS:
- Right-click on any axis of your graph and select Format Axis.
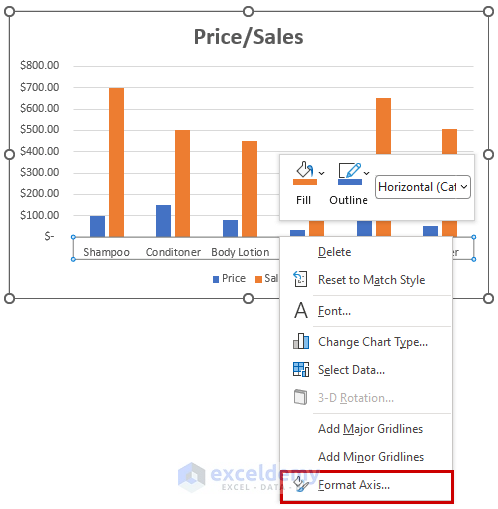
- This will open the Format Axis window on the right side of your Excel sheet.
- Go to Axis Options and change the Minimum and Maximum values.
Things to Remember
- Even after a chart has been generated, Excel makes it simple to change its type. Click within the chart to access the “Chart Design” page, then look for the “Change Chart Type” option and choose the new type of chart you wish to use.
- When we build a chart in Microsoft Office Excel, the vertical (value) axis, also referred to as the y-axis, has minimum and maximum scale values that are determined. To best suit purposes, we may alter the scale.
Download Practice Workbook
Related Articles
- How to Hide Zero Values in Excel Chart
- How to Mirror Chart in Excel
- How to Resize Chart Area Without Resizing Plot Area in Excel
<< Go Back to Customize Excel Charts | Excel Charts | Learn Excel
Get FREE Advanced Excel Exercises with Solutions!
